Hi @v_v_ramarao,
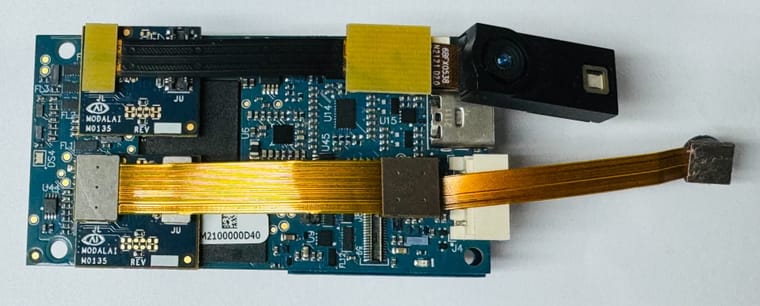
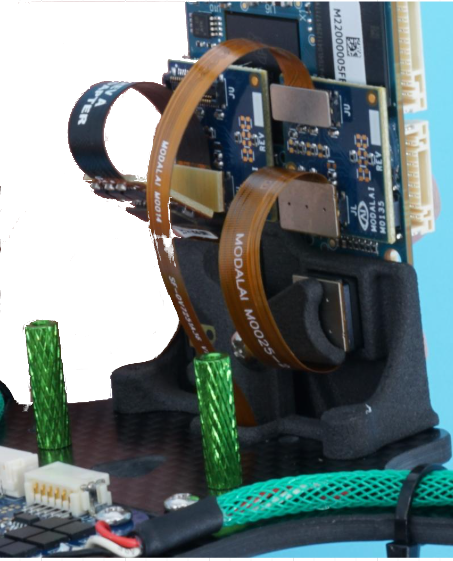
I have updated the script that i made last week to log and plot barometer data and ran a test on voxl2 mini. I have 3 cameras hooked up:
- J6 IMX214
- J7 IMX412 and AR0144
This is not exactly the same setup as you have (specifically, the IMX214 camera is in another slot), but we can compare the results.
You can copy the script below to voxl2 mini from your PC:
adb push plot_px4_baro.py /home/root/
install plotly on voxl2 mini (internet connection required) using:
pip3 install plotly --upgrade
Then run the script to collect 1000 samples:
cd /home/root/
python3 plot_px4_baro.py -n 1000
(1)[2288480501.0] P: 102151.375, T: 36.17676
(2)[2288607104.0] P: 102150.70312, T: 36.17943
(3)[2288733681.0] P: 102151.45312, T: 36.17409
(4)[2288860227.0] P: 102151.75, T: 36.17409
(5)[2288986782.0] P: 102149.32812, T: 36.17142
...
The first number is sample count, then timestamp (microseconds), then pressure and temperature.
After you start your script, wait for a few seconds and then start camera server and make sure that you are actually viewing the image from the camera (perhaps using voxl-portal
or just inspecting using voxl-inspect-cam hires_color
or something like that. If there are no clients for the camera, not much will be done in camera server, but you can try either way).
When the sample count reaches around 800, you can stop the camera server to see the effect of removing the system load and turning off the cameras. When the script is finished, it will generate a file barometer_test_results.html
which you need to copy back to your PC and open in browser :
adb pull /home/root/barometer_test_results.html
I just ran this test and here is the plot. It seems when temperature changed from 40C to 60C, the approximate height change was about 8 meters. This is quite substantial, but i did not see any unusual noise, which could be coming from power supply issues. No change in barometer noise when camera server was turned on and off.
Please try to run the same test and post the resulting plot, if you don't mind. This will help with figuring out the issue. Meanwhile, I will double check if the barometer code in PX4 implements temperature compensation, since 8 meter drift seems too much.
test script ( plot_px4_baro.py
) :
import subprocess
import time
import numpy as np
import argparse
# install plotly using pip3 install plotly --upgrade
parser = argparse.ArgumentParser(description='Barometer Test Script')
parser.add_argument('-n','--num-samples', type=int, required=False, default=1000)
args = parser.parse_args()
max_sample_count = args.num_samples
def get_px4_baro():
cmd = 'px4-listener sensor_baro'
p = subprocess.Popen(cmd, shell=True, stdout=subprocess.PIPE, stderr=subprocess.STDOUT)
timestamp = None
pressure = None
temperature = None
for line in p.stdout.readlines():
l=str(line)
#print(l)
if 'timestamp' in l:
ll = l.split(':')[1].split()[0]
timestamp = float(ll)
if 'pressure' in l:
ll = l.split(':')[-1][:-3]
pressure = float(ll)
if 'temperature' in l:
ll = l.split(':')[-1][:-3]
temperature = float(ll)
retval = p.wait()
return (timestamp,pressure,temperature)
tlast = 0
ts = []
ps = []
temps = []
sample_count = 0
while (sample_count < max_sample_count):
(timestamp, pressure, temperature) = get_px4_baro()
#make sure we got new data
if timestamp != tlast:
sample_count += 1
ts.append(timestamp)
ps.append(pressure)
temps.append(temperature)
print(f'({sample_count})[{timestamp}] P: {pressure}, T: {temperature}')
tlast=timestamp
time.sleep(0.01)
print('Finished collecting data')
print('Generating plots..')
try:
import plotly.graph_objects as go
from plotly.subplots import make_subplots
except:
print('WARNING: In order to plot the results, install the Python "plotly" module: pip3 install plotly --upgrade')
sys.exit(0)
fig = make_subplots(rows=3, cols=1, start_cell="top-left")
ts_plot = np.array(ts)
ts_plot -= ts_plot[0]
ts_plot *= 0.000001 #convert from us to s
# calculate approximate height from start
dh = np.array(ps)
dh -= dh[0] # subtract the first value
dh /= 12.0 # about 12 Pascals per meter at standard pressure and temperature
fig.add_trace(go.Scatter(x=ts_plot, y=np.array(ps), name='Pressure (Pa)'), row=1, col=1)
fig.add_trace(go.Scatter(x=ts_plot, y=np.array(temps), name='Temperature (deg C)'), row=2, col=1)
fig.add_trace(go.Scatter(x=ts_plot, y=dh, name='Approx Height (m)'), row=3, col=1)
fig.update_layout(title_text='Barometer Test Results')
fig.update_xaxes(title_text='Time (s)',row=1, col=1)
fig.update_yaxes(title_text='Pressure (Pa)',row=1, col=1)
fig.update_xaxes(title_text='Time (s)',row=2, col=1)
fig.update_yaxes(title_text='Temperature (deg C)',row=2, col=1)
fig.update_xaxes(title_text='Time (s)',row=3, col=1)
fig.update_yaxes(title_text='Approx Height (m)',row=3, col=1)
fig.update_xaxes(matches='x')
fig.write_html('barometer_test_results.html',include_plotlyjs='cdn')
#fig.show() #the figure will not show on VOXL because there is no display / browser
print('done')