
VOXL 2 Connecting an External Flight Controller Problem
-
@ravi Can you stop the system service for voxl-mavlink-server (e.g. systemctl stop voxl-mavlink-server) and run it from the command line instead with the -z option to see all message traffic? You should see something like this:
voxl2:/$ voxl-mavlink-server -z Enabling UDP to slpi recv debugging Enabling qrb5165 external AP recv debugging Enabling UDP to slpi send debugging Enabling qrb5165 external AP send debugging Enabling UDP GCS recv debugging Enabling UDP GCS send debugging loading our own config file ================================================================= Parameters as loaded from config file: primary_static_gcs_ip: 192.168.0.131 secondary_static_gcs_ip: 192.168.8.11 onboard_port_to_autopilot: 14556 onboard_port_from_autopilot: 14557 gcs_port_to_autopilot: 14558 gcs_port_from_autopilot: 14559 en_external_uart_ap: 1 autopilot_uart_bus: 12 autopilot_uart_baudrate: 57600 autopilot_mission_delay_start: -1 autopilot_mission_delay_sound: 0 autopilot_mission_force_restart: 0 autopilot_mission_notif_dur: 0.10 udp_mtu: 0 gcs_timeout_s 4.50 en_external_ap_timesync: 1 en_external_ap_heartbeat: 1 ================================================================= Sending library name request: libslpi_qrb5165_io.so Sending initialization request Successfully opened bus 12 at baudrate 57600 starting qrb5165 external AP receive thread Adding primary GCS IP address from conf file to list: 192.168.0.131 Added new UDP connection to 192.168.0.131 Adding secondary manual gcs IP address to udp connection list: 192.168.8.11 Added new UDP connection to 192.168.8.11 Init complete, entering main loop to AP msg ID: 0 sysid: 1 to bus: 12 RECV msg ID: 70 sysid:255 from bus: 12@Eric-Katzfey
For testing, I changed the UART port to 2 and then change to port 12.
stopped service and ran "voxl-mavlink-server -z"
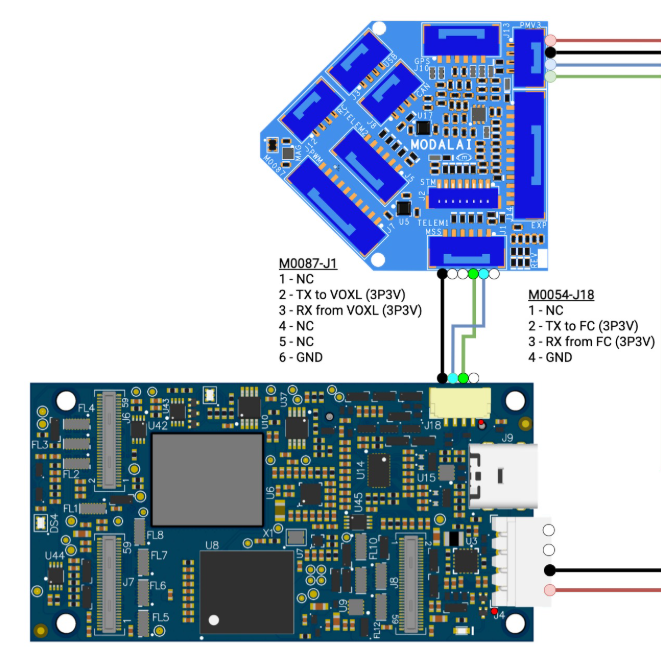
and got the following errors.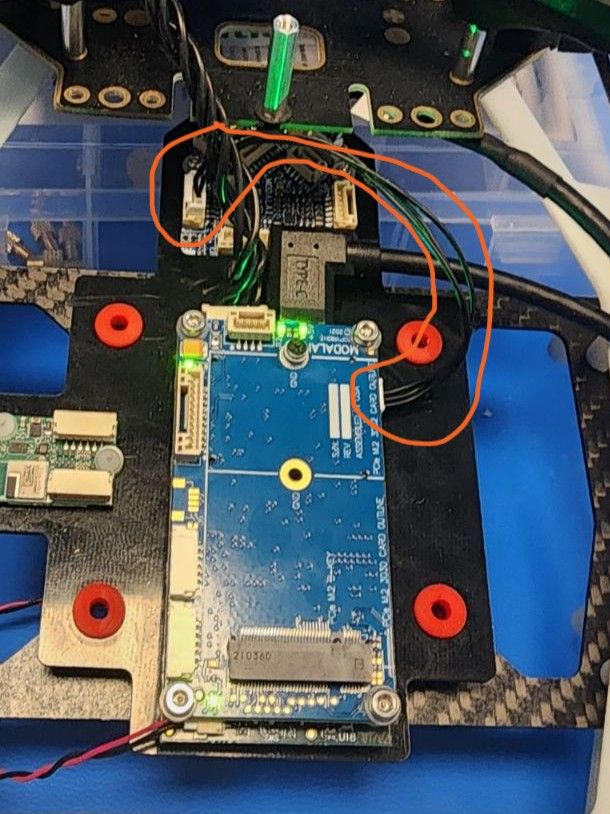 code_textThen rebooted the VOXl2 and tried again, and got this log. But no MAVLink connection with FCv2. using J1 of FCv2 to connect with J18 of VOXL2.
voxl2:/$ voxl-mavlink-server -z
Enabling UDP to slpi recv debugging
Enabling qrb5165 external AP recv debugging
Enabling UDP to slpi send debugging
Enabling qrb5165 external AP send debugging
Enabling UDP GCS recv debugging
Enabling UDP GCS send debugging
loading our own config file
=================================================================
Parameters as loaded from config file:
primary_static_gcs_ip:
secondary_static_gcs_ip:
onboard_port_to_autopilot:    14556
onboard_port_from_autopilot:  14557
gcs_port_to_autopilot:        14558
gcs_port_from_autopilot:      14559
en_external_uart_ap:          1
autopilot_uart_bus:           12
autopilot_uart_baudrate:      57600
autopilot_mission_delay_start:      -1
autopilot_mission_delay_sound:      0
autopilot_mission_force_restart:      0
autopilot_mission_notif_dur:      0.10
udp_mtu:                      500
gcs_timeout_s                 4.50
en_external_ap_timesync:      1
en_external_ap_heartbeat:     1
=================================================================
Sending library name request: libslpi_qrb5165_io.so
Sending initialization request
Successfully opened bus 12 at baudrate 57600
starting qrb5165 external AP receive thread
Not connecting to primary gcs ip:
Not connecting to secondary gcs ip:
Init complete, entering main loop
onboard  pipe  ID: 330 compid: 197
to AP msg ID:   330 sysid:  1   to bus: 12
onboard  pipe  ID:  84 compid: 197
to AP msg ID:    84 sysid:  1   to bus: 12
onboard  pipe  ID: 331 compid: 197
to AP msg ID:   331 sysid:  1   to bus: 12
onboard  pipe  ID:  84 compid: 197
to AP msg ID:    84 sysid:  1   to bus: 12
onboard  pipe  ID: 330 compid: 197
Check by heartbeat check. But no ap heartbeat.
voxl2:~/old_backup/etc-modalai/modalai$ voxl-inspect-mavlink mavlink_ap_heartbeat waiting for pipe to connect -
@Eric-Katzfey
For testing, I changed the UART port to 2 and then change to port 12.
stopped service and ran "voxl-mavlink-server -z"
and got the following errors. code_textThen rebooted the VOXl2 and tried again, and got this log. But no MAVLink connection with FCv2. using J1 of FCv2 to connect with J18 of VOXL2.
voxl2:/$ voxl-mavlink-server -z
Enabling UDP to slpi recv debugging
Enabling qrb5165 external AP recv debugging
Enabling UDP to slpi send debugging
Enabling qrb5165 external AP send debugging
Enabling UDP GCS recv debugging
Enabling UDP GCS send debugging
loading our own config file
=================================================================
Parameters as loaded from config file:
primary_static_gcs_ip:
secondary_static_gcs_ip:
onboard_port_to_autopilot:    14556
onboard_port_from_autopilot:  14557
gcs_port_to_autopilot:        14558
gcs_port_from_autopilot:      14559
en_external_uart_ap:          1
autopilot_uart_bus:           12
autopilot_uart_baudrate:      57600
autopilot_mission_delay_start:      -1
autopilot_mission_delay_sound:      0
autopilot_mission_force_restart:      0
autopilot_mission_notif_dur:      0.10
udp_mtu:                      500
gcs_timeout_s                 4.50
en_external_ap_timesync:      1
en_external_ap_heartbeat:     1
=================================================================
Sending library name request: libslpi_qrb5165_io.so
Sending initialization request
Successfully opened bus 12 at baudrate 57600
starting qrb5165 external AP receive thread
Not connecting to primary gcs ip:
Not connecting to secondary gcs ip:
Init complete, entering main loop
onboard  pipe  ID: 330 compid: 197
to AP msg ID:   330 sysid:  1   to bus: 12
onboard  pipe  ID:  84 compid: 197
to AP msg ID:    84 sysid:  1   to bus: 12
onboard  pipe  ID: 331 compid: 197
to AP msg ID:   331 sysid:  1   to bus: 12
onboard  pipe  ID:  84 compid: 197
to AP msg ID:    84 sysid:  1   to bus: 12
onboard  pipe  ID: 330 compid: 197
Check by heartbeat check. But no ap heartbeat.
voxl2:~/old_backup/etc-modalai/modalai$ voxl-inspect-mavlink mavlink_ap_heartbeat waiting for pipe to connectAlso, seeing the following error messages pointing flight controller.
onboard pipe ID: 331 compid: 197 to AP msg ID: 331 sysid: 1 to bus: 12 Sending topic message --- msg_id: 1033 --- topic name: uart_data onboard pipe ID: 84 compid: 197 to AP msg ID: 84 sysid: 1 to bus: 12 Sending topic message --- msg_id: 1033 --- topic name: uart_data Connection error: connection reset onboard pipe ID: 331 compid: 197 to AP msg ID: 331 sysid: 1 to bus: 12 Sending topic message --- msg_id: 1033 --- topic name: uart_data Got response cb 0 Got flight controller event Received standard error event SNS_STD_ERROR_NOT_SUPPORTED onboard pipe ID: 84 compid: 197 to AP msg ID: 84 sysid: 1 to bus: 12 Sending topic message --- msg_id: 1033 --- topic name: uart_data Got response cb 0 Got flight controller event Received standard error event SNS_STD_ERROR_NOT_SUPPORTED onboard pipe ID: 330 compid: 197 to AP msg ID: 330 sysid: 1 to bus: 12 Sending topic message --- msg_id: 1033 --- topic name: uart_data Got response cb 0 Got flight controller event Received standard error event SNS_STD_ERROR_NOT_SUPPORTED onboard pipe ID: 331 compid: 197 to AP msg ID: 331 sysid: 1 to bus: 12 Sending topic message --- msg_id: 1033 --- topic name: uart_data Got flight controller event Received standard error event SNS_STD_ERROR_NOT_SUPPORTED Got response cb 0 onboard pipe ID: 84 compid: 197 to AP msg ID: 84 sysid: 1 to bus: 12 Sending topic message --- msg_id: 1033 --- topic name: uart_data Got response cb 0 Got flight controller event Received standard error event SNS_STD_ERROR_NOT_SUPPORTED onboard pipe ID: 331 compid: 197 to AP msg ID: 331 sysid: 1 to bus: 12 Sending topic message --- msg_id: 1033 --- topic name: uart_data Got response cb 0 Got flight controller event Received standard error event SNS_STD_ERROR_NOT_SUPPORTED onboard pipe ID: 330 compid: 197 to AP msg ID: 330 sysid: 1 to bus: 12 Sending topic message --- msg_id: 1033 --- topic name: uart_data Got response cb 0 Got flight controller event Received standard error event SNS_STD_ERROR_NOT_SUPPORTED onboard pipe ID: 84 compid: 197 to AP msg ID: 84 sysid: 1 to bus: 12 Sending topic message --- msg_id: 1033 --- topic name: uart_data Got response cb 0 Got flight controller event Received standard error event SNS_STD_ERROR_NOT_SUPPORTED onboard pipe ID: 331 compid: 197 to AP msg ID: 331 sysid: 1 to bus: 12 Sending topic message --- msg_id: 1033 --- topic name: uart_data Got response cb 0 Got flight controller event Received standard error event SNS_STD_ERROR_NOT_SUPPORTED onboard pipe ID: 84 compid: 197 to AP msg ID: 84 sysid: 1 to bus: 12 Sending topic message --- msg_id: 1033 --- topic name: uart_data Got flight controller event Received standard error event SNS_STD_ERROR_NOT_SUPPORTED Got response cb 0 onboard pipe ID: 330 compid: 197 to AP msg ID: 330 sysid: 1 to bus: 12 Sending topic message --- msg_id: 1033 --- topic name: uart_data Got response cb 0 Got flight controller event Received standard error event SNS_STD_ERROR_NOT_SUPPORTED onboard pipe ID: 331 compid: 197 to AP msg ID: 331 sysid: 1 to bus: 12 Sending topic message --- msg_id: 1033 --- topic name: uart_data Got response cb 0 Got flight controller event Received standard error event SNS_STD_ERROR_NOT_SUPPORTED onboard pipe ID: 84 compid: 197 to AP msg ID: 84 sysid: 1 to bus: 12 Sending topic message --- msg_id: 1033 --- topic name: uart_data Got response cb 0 Got flight controller event Received standard error event SNS_STD_ERROR_NOT_SUPPORTED onboard pipe ID: 331 compid: 197 to AP msg ID: 331 sysid: 1 to bus: 12 Sending topic message --- msg_id: 1033 --- topic name: uart_data Got response cb 0 Got flight controller event Received standard error event SNS_STD_ERROR_NOT_SUPPORTED onboard pipe ID: 330 compid: 197 to AP msg ID: 330 sysid: 1 to bus: 12 Sending topic message --- msg_id: 1033 --- topic name: uart_data Got flight controller event Received standard error event SNS_STD_ERROR_NOT_SUPPORTED Got response cb 0 onboard pipe ID: 84 compid: 197 to AP msg ID: 84 sysid: 1 to bus: 12 Sending topic message --- msg_id: 1033 --- topic name: uart_data Got response cb 0 onboard pipe ID: 331 compid: 197 to AP msg ID: 331 sysid: 1 to bus: 12 Sending topic message --- msg_id: 1033 --- topic name: uart_data Got response cb 0 onboard pipe ID: 84 compid: 197 to AP msg ID: 84 sysid: 1 to bus: 12 Sending topic message --- msg_id: 1033 --- topic name: uart_data Got response cb 0 onboard pipe ID: 330 compid: 197 to AP msg ID: 330 sysid: 1 to bus: 12 Sending topic message --- msg_id: 1033 --- topic name: uart_data Got response cb 0 onboard pipe ID: 331 compid: 197 to AP msg ID: 331 sysid: 1 to bus: 12 Sending topic message --- msg_id: 1033 --- topic name: uart_data Got response cb 0 onboard pipe ID: 84 compid: 197 to AP msg ID: 84 sysid: 1 to bus: 12 Sending topic message --- msg_id: 1033 --- topic name: uart_data Got response cb 0 onboard pipe ID: 331 compid: 197 to AP msg ID: 331 sysid: 1 to bus: 12 Sending topic message --- msg_id: 1033 --- topic name: uart_data Got response cb 0 onboard pipe ID: 330 compid: 197 to AP msg ID: 330 sysid: 1 to bus: 12 Sending topic message --- msg_id: 1033 --- topic name: uart_data Got response cb 0 onboard pipe ID: 84 compid: 197 to AP msg ID: 84 sysid: 1 to bus: 12 Sending topic message --- msg_id: 1033 --- topic name: uart_data Got response cb 0 onboard pipe ID: 331 compid: 197 to AP msg ID: 331 sysid: 1 to bus: 12 Sending topic message --- msg_id: 1033 --- topic name: uart_data Got response cb 0 onboard pipe ID: 84 compid: 197 to AP msg ID: 84 sysid: 1 to bus: 12 Sending topic message --- msg_id: 1033 --- topic name: uart_data Got response cb 0 onboard pipe ID: 331 compid: 197 to AP msg ID: 331 sysid: 1 to bus: 12 Sending topic message --- msg_id: 1033 --- topic name: uart_data Got response cb 0 onboard pipe ID: 330 compid: 197 to AP msg ID: 330 sysid: 1 to bus: 12 Sending topic message --- msg_id: 1033 --- topic name: uart_data -
Also, seeing the following error messages pointing flight controller.
onboard pipe ID: 331 compid: 197 to AP msg ID: 331 sysid: 1 to bus: 12 Sending topic message --- msg_id: 1033 --- topic name: uart_data onboard pipe ID: 84 compid: 197 to AP msg ID: 84 sysid: 1 to bus: 12 Sending topic message --- msg_id: 1033 --- topic name: uart_data Connection error: connection reset onboard pipe ID: 331 compid: 197 to AP msg ID: 331 sysid: 1 to bus: 12 Sending topic message --- msg_id: 1033 --- topic name: uart_data Got response cb 0 Got flight controller event Received standard error event SNS_STD_ERROR_NOT_SUPPORTED onboard pipe ID: 84 compid: 197 to AP msg ID: 84 sysid: 1 to bus: 12 Sending topic message --- msg_id: 1033 --- topic name: uart_data Got response cb 0 Got flight controller event Received standard error event SNS_STD_ERROR_NOT_SUPPORTED onboard pipe ID: 330 compid: 197 to AP msg ID: 330 sysid: 1 to bus: 12 Sending topic message --- msg_id: 1033 --- topic name: uart_data Got response cb 0 Got flight controller event Received standard error event SNS_STD_ERROR_NOT_SUPPORTED onboard pipe ID: 331 compid: 197 to AP msg ID: 331 sysid: 1 to bus: 12 Sending topic message --- msg_id: 1033 --- topic name: uart_data Got flight controller event Received standard error event SNS_STD_ERROR_NOT_SUPPORTED Got response cb 0 onboard pipe ID: 84 compid: 197 to AP msg ID: 84 sysid: 1 to bus: 12 Sending topic message --- msg_id: 1033 --- topic name: uart_data Got response cb 0 Got flight controller event Received standard error event SNS_STD_ERROR_NOT_SUPPORTED onboard pipe ID: 331 compid: 197 to AP msg ID: 331 sysid: 1 to bus: 12 Sending topic message --- msg_id: 1033 --- topic name: uart_data Got response cb 0 Got flight controller event Received standard error event SNS_STD_ERROR_NOT_SUPPORTED onboard pipe ID: 330 compid: 197 to AP msg ID: 330 sysid: 1 to bus: 12 Sending topic message --- msg_id: 1033 --- topic name: uart_data Got response cb 0 Got flight controller event Received standard error event SNS_STD_ERROR_NOT_SUPPORTED onboard pipe ID: 84 compid: 197 to AP msg ID: 84 sysid: 1 to bus: 12 Sending topic message --- msg_id: 1033 --- topic name: uart_data Got response cb 0 Got flight controller event Received standard error event SNS_STD_ERROR_NOT_SUPPORTED onboard pipe ID: 331 compid: 197 to AP msg ID: 331 sysid: 1 to bus: 12 Sending topic message --- msg_id: 1033 --- topic name: uart_data Got response cb 0 Got flight controller event Received standard error event SNS_STD_ERROR_NOT_SUPPORTED onboard pipe ID: 84 compid: 197 to AP msg ID: 84 sysid: 1 to bus: 12 Sending topic message --- msg_id: 1033 --- topic name: uart_data Got flight controller event Received standard error event SNS_STD_ERROR_NOT_SUPPORTED Got response cb 0 onboard pipe ID: 330 compid: 197 to AP msg ID: 330 sysid: 1 to bus: 12 Sending topic message --- msg_id: 1033 --- topic name: uart_data Got response cb 0 Got flight controller event Received standard error event SNS_STD_ERROR_NOT_SUPPORTED onboard pipe ID: 331 compid: 197 to AP msg ID: 331 sysid: 1 to bus: 12 Sending topic message --- msg_id: 1033 --- topic name: uart_data Got response cb 0 Got flight controller event Received standard error event SNS_STD_ERROR_NOT_SUPPORTED onboard pipe ID: 84 compid: 197 to AP msg ID: 84 sysid: 1 to bus: 12 Sending topic message --- msg_id: 1033 --- topic name: uart_data Got response cb 0 Got flight controller event Received standard error event SNS_STD_ERROR_NOT_SUPPORTED onboard pipe ID: 331 compid: 197 to AP msg ID: 331 sysid: 1 to bus: 12 Sending topic message --- msg_id: 1033 --- topic name: uart_data Got response cb 0 Got flight controller event Received standard error event SNS_STD_ERROR_NOT_SUPPORTED onboard pipe ID: 330 compid: 197 to AP msg ID: 330 sysid: 1 to bus: 12 Sending topic message --- msg_id: 1033 --- topic name: uart_data Got flight controller event Received standard error event SNS_STD_ERROR_NOT_SUPPORTED Got response cb 0 onboard pipe ID: 84 compid: 197 to AP msg ID: 84 sysid: 1 to bus: 12 Sending topic message --- msg_id: 1033 --- topic name: uart_data Got response cb 0 onboard pipe ID: 331 compid: 197 to AP msg ID: 331 sysid: 1 to bus: 12 Sending topic message --- msg_id: 1033 --- topic name: uart_data Got response cb 0 onboard pipe ID: 84 compid: 197 to AP msg ID: 84 sysid: 1 to bus: 12 Sending topic message --- msg_id: 1033 --- topic name: uart_data Got response cb 0 onboard pipe ID: 330 compid: 197 to AP msg ID: 330 sysid: 1 to bus: 12 Sending topic message --- msg_id: 1033 --- topic name: uart_data Got response cb 0 onboard pipe ID: 331 compid: 197 to AP msg ID: 331 sysid: 1 to bus: 12 Sending topic message --- msg_id: 1033 --- topic name: uart_data Got response cb 0 onboard pipe ID: 84 compid: 197 to AP msg ID: 84 sysid: 1 to bus: 12 Sending topic message --- msg_id: 1033 --- topic name: uart_data Got response cb 0 onboard pipe ID: 331 compid: 197 to AP msg ID: 331 sysid: 1 to bus: 12 Sending topic message --- msg_id: 1033 --- topic name: uart_data Got response cb 0 onboard pipe ID: 330 compid: 197 to AP msg ID: 330 sysid: 1 to bus: 12 Sending topic message --- msg_id: 1033 --- topic name: uart_data Got response cb 0 onboard pipe ID: 84 compid: 197 to AP msg ID: 84 sysid: 1 to bus: 12 Sending topic message --- msg_id: 1033 --- topic name: uart_data Got response cb 0 onboard pipe ID: 331 compid: 197 to AP msg ID: 331 sysid: 1 to bus: 12 Sending topic message --- msg_id: 1033 --- topic name: uart_data Got response cb 0 onboard pipe ID: 84 compid: 197 to AP msg ID: 84 sysid: 1 to bus: 12 Sending topic message --- msg_id: 1033 --- topic name: uart_data Got response cb 0 onboard pipe ID: 331 compid: 197 to AP msg ID: 331 sysid: 1 to bus: 12 Sending topic message --- msg_id: 1033 --- topic name: uart_data Got response cb 0 onboard pipe ID: 330 compid: 197 to AP msg ID: 330 sysid: 1 to bus: 12 Sending topic message --- msg_id: 1033 --- topic name: uart_datamavlink-server status issue seems random.
I stopped the service and changed the baud rate, and ran app from the terminal "voxl-mavlink-server"
Seems MAVLink connection established. and getting an AP heart rate at 0.3Hz.
Then I tried the same with mavlink service.
I terminated it running process for the mavlik-server.
They started the MAVLink service. and checked status and not starting.voxl2:/$ systemctl start voxl-mavlink-server voxl2:/$ systemctl status voxl-mavlink-server ● voxl-mavlink-server.service - voxl-mavlink-server Loaded: loaded (/usr/bin/voxl-mavlink-server; enabled; vendor preset: enabled) Active: failed (Result: exit-code) since Thu 2023-03-02 13:29:47 UTC; 3s ago Process: 11260 ExecStart=/usr/bin/voxl-mavlink-server (code=exited, status=255) Process: 11253 ExecStartPre=/bin/sleep 2 (code=exited, status=0/SUCCESS) Main PID: 11260 (code=exited, status=255) Mar 02 13:29:47 m0054 voxl-mavlink-server[11260]: ERROR: Unable to configure bus 12 (baudrate 460800) with voxl_io Mar 02 13:29:47 m0054 voxl-mavlink-server[11260]: Stopping autopilot io module Mar 02 13:29:47 m0054 voxl-mavlink-server[11260]: Stopping gcs io module Mar 02 13:29:47 m0054 voxl-mavlink-server[11260]: Stopping pipe io module Mar 02 13:29:47 m0054 voxl-mavlink-server[11260]: closing remaining client pipes Mar 02 13:29:47 m0054 voxl-mavlink-server[11260]: closing remaining server pipes Mar 02 13:29:47 m0054 voxl-mavlink-server[11260]: Removing PID file Mar 02 13:29:47 m0054 voxl-mavlink-server[11260]: exiting Mar 02 13:29:47 m0054 systemd[1]: voxl-mavlink-server.service: Main process exited, code=exited, status=255/n/a Mar 02 13:29:47 m0054 systemd[1]: voxl-mavlink-server.service: Failed with result 'exit-code'. voxl2:/$ systemctl start voxl-mavlink-serverThen tried from the terminal again, getting the error as below.
voxl2:/$ voxl-mavlink-server loading our own config file ================================================================= Parameters as loaded from config file: primary_static_gcs_ip: secondary_static_gcs_ip: onboard_port_to_autopilot: 14556 onboard_port_from_autopilot: 14557 gcs_port_to_autopilot: 14558 gcs_port_from_autopilot: 14559 en_external_uart_ap: 1 autopilot_uart_bus: 12 autopilot_uart_baudrate: 460800 autopilot_mission_delay_start: -1 autopilot_mission_delay_sound: 0 autopilot_mission_force_restart: 0 autopilot_mission_notif_dur: 0.10 udp_mtu: 500 gcs_timeout_s 4.50 en_external_ap_timesync: 1 en_external_ap_heartbeat: 1 ================================================================= Couldn't locate SUID for flight_controller Failed to detect flight controller sensor ERROR: fc_sensor_initialize failed ERROR: Failed to initialize slpi ERROR: Encountered error while initializing bus 12 ERROR: Unable to configure bus 12 (baudrate 460800) with voxl_io Stopping autopilot io module Stopping gcs io module Stopping pipe io module closing remaining client pipes closing remaining server pipes Removing PID file exiting voxl2:/$ voxl-mavlink-server -z Enabling UDP to slpi recv debugging Enabling qrb5165 external AP recv debugging Enabling UDP to slpi send debugging Enabling qrb5165 external AP send debugging Enabling UDP GCS recv debugging Enabling UDP GCS send debugging loading our own config file ================================================================= Parameters as loaded from config file: primary_static_gcs_ip: secondary_static_gcs_ip: onboard_port_to_autopilot: 14556 onboard_port_from_autopilot: 14557 gcs_port_to_autopilot: 14558 gcs_port_from_autopilot: 14559 en_external_uart_ap: 1 autopilot_uart_bus: 12 autopilot_uart_baudrate: 460800 autopilot_mission_delay_start: -1 autopilot_mission_delay_sound: 0 autopilot_mission_force_restart: 0 autopilot_mission_notif_dur: 0.10 udp_mtu: 500 gcs_timeout_s 4.50 en_external_ap_timesync: 1 en_external_ap_heartbeat: 1 ================================================================= Couldn't locate SUID for flight_controller Failed to detect flight controller sensor ERROR: fc_sensor_initialize failed ERROR: Failed to initialize slpi ERROR: Encountered error while initializing bus 12 ERROR: Unable to configure bus 12 (baudrate 460800) with voxl_io Stopping autopilot io module Stopping gcs io module Stopping pipe io module closing remaining client pipes closing remaining server pipes Removing PID file exiting voxl2:/$ -
mavlink-server status issue seems random.
I stopped the service and changed the baud rate, and ran app from the terminal "voxl-mavlink-server"
Seems MAVLink connection established. and getting an AP heart rate at 0.3Hz.
Then I tried the same with mavlink service.
I terminated it running process for the mavlik-server.
They started the MAVLink service. and checked status and not starting.voxl2:/$ systemctl start voxl-mavlink-server voxl2:/$ systemctl status voxl-mavlink-server ● voxl-mavlink-server.service - voxl-mavlink-server Loaded: loaded (/usr/bin/voxl-mavlink-server; enabled; vendor preset: enabled) Active: failed (Result: exit-code) since Thu 2023-03-02 13:29:47 UTC; 3s ago Process: 11260 ExecStart=/usr/bin/voxl-mavlink-server (code=exited, status=255) Process: 11253 ExecStartPre=/bin/sleep 2 (code=exited, status=0/SUCCESS) Main PID: 11260 (code=exited, status=255) Mar 02 13:29:47 m0054 voxl-mavlink-server[11260]: ERROR: Unable to configure bus 12 (baudrate 460800) with voxl_io Mar 02 13:29:47 m0054 voxl-mavlink-server[11260]: Stopping autopilot io module Mar 02 13:29:47 m0054 voxl-mavlink-server[11260]: Stopping gcs io module Mar 02 13:29:47 m0054 voxl-mavlink-server[11260]: Stopping pipe io module Mar 02 13:29:47 m0054 voxl-mavlink-server[11260]: closing remaining client pipes Mar 02 13:29:47 m0054 voxl-mavlink-server[11260]: closing remaining server pipes Mar 02 13:29:47 m0054 voxl-mavlink-server[11260]: Removing PID file Mar 02 13:29:47 m0054 voxl-mavlink-server[11260]: exiting Mar 02 13:29:47 m0054 systemd[1]: voxl-mavlink-server.service: Main process exited, code=exited, status=255/n/a Mar 02 13:29:47 m0054 systemd[1]: voxl-mavlink-server.service: Failed with result 'exit-code'. voxl2:/$ systemctl start voxl-mavlink-serverThen tried from the terminal again, getting the error as below.
voxl2:/$ voxl-mavlink-server loading our own config file ================================================================= Parameters as loaded from config file: primary_static_gcs_ip: secondary_static_gcs_ip: onboard_port_to_autopilot: 14556 onboard_port_from_autopilot: 14557 gcs_port_to_autopilot: 14558 gcs_port_from_autopilot: 14559 en_external_uart_ap: 1 autopilot_uart_bus: 12 autopilot_uart_baudrate: 460800 autopilot_mission_delay_start: -1 autopilot_mission_delay_sound: 0 autopilot_mission_force_restart: 0 autopilot_mission_notif_dur: 0.10 udp_mtu: 500 gcs_timeout_s 4.50 en_external_ap_timesync: 1 en_external_ap_heartbeat: 1 ================================================================= Couldn't locate SUID for flight_controller Failed to detect flight controller sensor ERROR: fc_sensor_initialize failed ERROR: Failed to initialize slpi ERROR: Encountered error while initializing bus 12 ERROR: Unable to configure bus 12 (baudrate 460800) with voxl_io Stopping autopilot io module Stopping gcs io module Stopping pipe io module closing remaining client pipes closing remaining server pipes Removing PID file exiting voxl2:/$ voxl-mavlink-server -z Enabling UDP to slpi recv debugging Enabling qrb5165 external AP recv debugging Enabling UDP to slpi send debugging Enabling qrb5165 external AP send debugging Enabling UDP GCS recv debugging Enabling UDP GCS send debugging loading our own config file ================================================================= Parameters as loaded from config file: primary_static_gcs_ip: secondary_static_gcs_ip: onboard_port_to_autopilot: 14556 onboard_port_from_autopilot: 14557 gcs_port_to_autopilot: 14558 gcs_port_from_autopilot: 14559 en_external_uart_ap: 1 autopilot_uart_bus: 12 autopilot_uart_baudrate: 460800 autopilot_mission_delay_start: -1 autopilot_mission_delay_sound: 0 autopilot_mission_force_restart: 0 autopilot_mission_notif_dur: 0.10 udp_mtu: 500 gcs_timeout_s 4.50 en_external_ap_timesync: 1 en_external_ap_heartbeat: 1 ================================================================= Couldn't locate SUID for flight_controller Failed to detect flight controller sensor ERROR: fc_sensor_initialize failed ERROR: Failed to initialize slpi ERROR: Encountered error while initializing bus 12 ERROR: Unable to configure bus 12 (baudrate 460800) with voxl_io Stopping autopilot io module Stopping gcs io module Stopping pipe io module closing remaining client pipes closing remaining server pipes Removing PID file exiting voxl2:/$I am testing with J18(VOXl2) and J1(TELEM1) port.
Seems SLPI is throwing a lot of errors in demsg.
and @115200 buadrate.- MAVLink connections are getting lost in a few minutes.
and getting rx loss of 124% on FCv2 QGC.
Can you let me know if the J18 DSP port is buggy or how to fix these errors?
After a few minutes or a few restarts of VOXl-mavlink-server. it stops working and shows an error and exitsCouldn't locate SUID for flight_controller Failed to detect flight controller sensor ERROR: fc_sensor_initialize failed ERROR: Failed to initialize slpi ERROR: Encountered error while initializing bus 12 ERROR: Unable to configure bus 12 (baudrate 115200) with voxl_io Stopping autopilot io module Stopping gcs io module Stopping pipe io module closing remaining client pipes closing remaining server pipes Removing PID file exiting====> dmesg log while voxl-mavlink-server running stopped working and throwing an error when starting
[  460.730018] adsprpc: fastrpc_restart_notifier_cb: received RAMDUMP notification for slpi
[  460.730717] subsys-restart: subsystem_powerup(): [kworker/u19:0:2054]: Powering up slpi
[  460.730901] subsys-pil-tz 5c00000.qcom,ssc: slpi: loading from 0x0000000088c00000 to 0x000000008a600000
[  460.790600] subsys-pil-tz 5c00000.qcom,ssc: slpi: Brought out of reset
[  460.853124] subsys-pil-tz 5c00000.qcom,ssc: Subsystem error monitoring/handling services are up
[  460.853154] subsys-pil-tz 5c00000.qcom,ssc: slpi: Power/Clock ready interrupt received
[  460.860922] adsprpc: fastrpc_restart_notifier_cb: slpi subsystem is up
[  460.860928] subsys-restart: subsystem_restart_wq_func(): [kworker/u19:0:2054]: Restart sequence for slpi completed.
[  460.861499] 1118855912:Entered
[  460.861942] 1118855912:SMD QRTR driver probed
[  460.862983] adsprpc: fastrpc_rpmsg_probe: opened rpmsg channel for slpi
[  460.866169] sysmon-qmi: ssctl_new_server: Connection established between QMI handle and slpi's SSCTL service
[  460.866208] coresight-remote-etm soc:ssc_etm0: Connection established between QMI handle and 8 service
[  460.874694] diag: In diag_send_peripheral_buffering_mode, buffering flag not set for 3
[  462.106273] Fatal error on slpi!
[  462.106348] slpi subsystem failure reason: err_qdi.c:1079:EF:sensor_process:0x1:SNS_SEE_I_1:0x68:sns_stream_service.c:436:req_found.
[  462.106375] subsys-restart: subsystem_restart_dev(): Restart sequence requested for slpi, restart_level = RELATED.
[  462.108414] adsprpc: fastrpc_restart_notifier_cb: slpi subsystem is restarting
[  462.108416] subsys-restart: subsystem_shutdown(): [kworker/u19:0:2054]: Shutting down slpi
[  462.120395] rpmh_rsc_send_data: 17 callbacks suppressed
[  462.120396] qcom_rpmh DRV:apps_rsc TCS Busy, retrying RPMH message send: addr=0x30030
[  462.120423] qcom_rpmh DRV:apps_rsc TCS Busy, retrying RPMH message send: addr=0x30040
[  462.121677] coresight-remote-etm soc:ssc_etm0: Connection disconnected between QMI handle and 8 service
[  462.121691] sysmon-qmi: ssctl_del_server: Connection lost between QMI handle and slpi's SSCTL service
[  462.122027] adsprpc: fastrpc_rpmsg_remove: closed rpmsg channel of slpi
[  462.122151] adsprpc: fastrpc_restart_notifier_cb: received RAMDUMP notification for slpi
[  462.122757] subsys-restart: subsystem_powerup(): [kworker/u19:0:2054]: Powering up slpi
[  462.122886] subsys-pil-tz 5c00000.qcom,ssc: slpi: loading from 0x0000000088c00000 to 0x000000008a600000
[  462.178193] subsys-pil-tz 5c00000.qcom,ssc: slpi: Brought out of reset
[  462.240639] subsys-pil-tz 5c00000.qcom,ssc: Subsystem error monitoring/handling services are up
[  462.240671] subsys-pil-tz 5c00000.qcom,ssc: slpi: Power/Clock ready interrupt received
[  462.240789] qcom_rpmh DRV:apps_rsc TCS Busy, retrying RPMH message send: addr=0x30040
[  462.247665] 1118855912:Entered
[  462.248151] adsprpc: fastrpc_restart_notifier_cb: slpi subsystem is up
[  462.248158] subsys-restart: subsystem_restart_wq_func(): [kworker/u19:0:2054]: Restart sequence for slpi completed.
[  462.249366] 1118855912:SMD QRTR driver probed
[  462.252554] adsprpc: fastrpc_rpmsg_probe: opened rpmsg channel for slpi
[  462.254897] sysmon-qmi: ssctl_new_server: Connection established between QMI handle and slpi's SSCTL service
[  462.254962] coresight-remote-etm soc:ssc_etm0: Connection established between QMI handle and 8 service
[  462.261500] diag: In diag_send_peripheral_buffering_mode, buffering flag not set for 3
[  463.481618] Fatal error on slpi!
[  463.481694] slpi subsystem failure reason: err_qdi.c:1079:EF:sensor_process:0x1:SNS_SEE_I_1:0x68:sns_stream_service.c:436:req_found.
[  463.481720] subsys-restart: subsystem_restart_dev(): Restart sequence requested for slpi, restart_level = RELATED.
[  463.483312] adsprpc: fastrpc_restart_notifier_cb: slpi subsystem is restarting
[  463.483315] subsys-restart: subsystem_shutdown(): [kworker/u19:0:2054]: Shutting down slpi
[  463.495481] qcom_rpmh DRV:apps_rsc TCS Busy, retrying RPMH message send: addr=0x30030
[  463.495494] qcom_rpmh DRV:apps_rsc TCS Busy, retrying RPMH message send: addr=0x30030
[  463.495505] qcom_rpmh DRV:apps_rsc TCS Busy, retrying RPMH message send: addr=0x30030
[  463.495516] qcom_rpmh DRV:apps_rsc TCS Busy, retrying RPMH message send: addr=0x30030
[  463.495528] qcom_rpmh DRV:apps_rsc TCS Busy, retrying RPMH message send: addr=0x30030
[  463.495539] qcom_rpmh DRV:apps_rsc TCS Busy, retrying RPMH message send: addr=0x30030
[  463.495551] qcom_rpmh DRV:apps_rsc TCS Busy, retrying RPMH message send: addr=0x30030
[  463.498539] coresight-remote-etm soc:ssc_etm0: Connection disconnected between QMI handle and 8 service
[  463.498548] sysmon-qmi: ssctl_del_server: Connection lost between QMI handle and slpi's SSCTL service
[  463.498944] adsprpc: fastrpc_rpmsg_remove: closed rpmsg channel of slpi
[  463.499294] adsprpc: fastrpc_restart_notifier_cb: received RAMDUMP notification for slpi
[  463.499834] subsys-restart: subsystem_powerup(): [kworker/u19:0:2054]: Powering up slpi
[  463.499987] subsys-pil-tz 5c00000.qcom,ssc: slpi: loading from 0x0000000088c00000 to 0x000000008a600000
[  463.558705] subsys-pil-tz 5c00000.qcom,ssc: slpi: Brought out of reset
[  463.619354] subsys-pil-tz 5c00000.qcom,ssc: Subsystem error monitoring/handling services are up
[  463.619389] subsys-pil-tz 5c00000.qcom,ssc: slpi: Power/Clock ready interrupt received
[  463.626313] adsprpc: fastrpc_restart_notifier_cb: slpi subsystem is up
[  463.626319] subsys-restart: subsystem_restart_wq_func(): [kworker/u19:0:2054]: Restart sequence for slpi completed.
[  463.629242] 1118855912:Entered
[  463.631383] 1118855912:SMD QRTR driver probed
[  463.633320] sysmon-qmi: ssctl_new_server: Connection established between QMI handle and slpi's SSCTL service
[  463.633334] coresight-remote-etm soc:ssc_etm0: Connection established between QMI handle and 8 service
[  463.633688] adsprpc: fastrpc_rpmsg_probe: opened rpmsg channel for slpi
[  463.641981] diag: In diag_send_peripheral_buffering_mode, buffering flag not set for 3
[  464.864191] Fatal error on slpi!
[  464.864266] slpi subsystem failure reason: err_qdi.c:1079:EF:sensor_process:0x1:SNS_SEE_I_0:0x69:sns_stream_service.c:436:req_found.
[  464.864291] subsys-restart: subsystem_restart_dev(): Restart sequence requested for slpi, restart_level = RELATED.
[  464.867315] adsprpc: fastrpc_restart_notifier_cb: slpi subsystem is restarting
[  464.867320] subsys-restart: subsystem_shutdown(): [kworker/u19:0:2054]: Shutting down slpi
[  464.883697] coresight-remote-etm soc:ssc_etm0: Connection disconnected between QMI handle and 8 service
[  464.883706] sysmon-qmi: ssctl_del_server: Connection lost between QMI handle and slpi's SSCTL service
[  464.885643] adsprpc: fastrpc_rpmsg_remove: closed rpmsg channel of slpi
[  464.885787] adsprpc: fastrpc_restart_notifier_cb: received RAMDUMP notification for slpi
[  464.887190] subsys-restart: subsystem_powerup(): [kworker/u19:0:2054]: Powering up slpi
[  464.887455] subsys-pil-tz 5c00000.qcom,ssc: slpi: loading from 0x0000000088c00000 to 0x000000008a600000
[  464.945581] subsys-pil-tz 5c00000.qcom,ssc: slpi: Brought out of reset
[  465.007996] subsys-pil-tz 5c00000.qcom,ssc: Subsystem error monitoring/handling services are up
[  465.008139] subsys-pil-tz 5c00000.qcom,ssc: slpi: Power/Clock ready interrupt received
[  465.015414] adsprpc: fastrpc_restart_notifier_cb: slpi subsystem is up
[  465.015420] subsys-restart: subsystem_restart_wq_func(): [kworker/u19:0:2054]: Restart sequence for slpi completed.
[  465.015924] 1118855912:Entered
[  465.016498] 1118855912:SMD QRTR driver probed
[  465.019954] adsprpc: fastrpc_rpmsg_probe: opened rpmsg channel for slpi
[  465.023578] sysmon-qmi: ssctl_new_server: Connection established between QMI handle and slpi's SSCTL service
[  465.023627] coresight-remote-etm soc:ssc_etm0: Connection established between QMI handle and 8 service
[  465.029301] diag: In diag_send_peripheral_buffering_mode, buffering flag not set for 3
[  466.256347] Fatal error on slpi!
[  466.256432] slpi subsystem failure reason: err_qdi.c:1079:EF:sensor_process:0x1:SNS_SEE_I_0:0x69:sns_stream_service.c:436:req_found.
[  466.256456] subsys-restart: subsystem_restart_dev(): Restart sequence requested for slpi, restart_level = RELATED.
[  466.259074] adsprpc: fastrpc_restart_notifier_cb: slpi subsystem is restarting
[  466.259079] subsys-restart: subsystem_shutdown(): [kworker/u19:0:2054]: Shutting down slpi
[  466.275522] coresight-remote-etm soc:ssc_etm0: Connection disconnected between QMI handle and 8 service
[  466.275806] sysmon-qmi: ssctl_del_server: Connection lost between QMI handle and slpi's SSCTL service
[  466.277897] adsprpc: fastrpc_rpmsg_remove: closed rpmsg channel of slpi
[  466.278247] adsprpc: fastrpc_restart_notifier_cb: received RAMDUMP notification for slpi
[  466.279336] subsys-restart: subsystem_powerup(): [kworker/u19:0:2054]: Powering up slpi
[  466.279500] subsys-pil-tz 5c00000.qcom,ssc: slpi: loading from 0x0000000088c00000 to 0x000000008a600000
[  466.338642] subsys-pil-tz 5c00000.qcom,ssc: slpi: Brought out of reset
[  466.399095] subsys-pil-tz 5c00000.qcom,ssc: Subsystem error monitoring/handling services are up
[  466.399127] subsys-pil-tz 5c00000.qcom,ssc: slpi: Power/Clock ready interrupt received
[  466.405824] adsprpc: fastrpc_restart_notifier_cb: slpi subsystem is up
[  466.405830] 1118855912:Entered
[  466.405832] subsys-restart: subsystem_restart_wq_func(): [kworker/u19:0:2054]: Restart sequence for slpi completed.
[  466.406031] 1118855912:SMD QRTR driver probed
[  466.407495] adsprpc: fastrpc_rpmsg_probe: opened rpmsg channel for slpi
[  466.411445] coresight-remote-etm soc:ssc_etm0: Connection established between QMI handle and 8 service
[  466.412552] sysmon-qmi: ssctl_new_server: Connection established between QMI handle and slpi's SSCTL service
[  466.419864] diag: In diag_send_peripheral_buffering_mode, buffering flag not set for 3
[  467.641878] Fatal error on slpi!
[  467.641957] slpi subsystem failure reason: err_qdi.c:1079:EF:sensor_process:0x1:SNS_SEE_I_1:0x68:sns_stream_service.c:436:req_found.
[  467.641983] subsys-restart: subsystem_restart_dev(): Restart sequence requested for slpi, restart_level = RELATED.
[  467.644997] adsprpc: fastrpc_restart_notifier_cb: slpi subsystem is restarting
[  467.645001] subsys-restart: subsystem_shutdown(): [kworker/u19:0:2054]: Shutting down slpi
[  467.656914] rpmh_rsc_send_data: 19 callbacks suppressed
[  467.656915] qcom_rpmh DRV:apps_rsc TCS Busy, retrying RPMH message send: addr=0x30030
[  467.656940] qcom_rpmh DRV:apps_rsc TCS Busy, retrying RPMH message send: addr=0x30040
[  467.658270] coresight-remote-etm soc:ssc_etm0: Connection disconnected between QMI handle and 8 service
[  467.658280] sysmon-qmi: ssctl_del_server: Connection lost between QMI handle and slpi's SSCTL service
[  467.658668] adsprpc: fastrpc_rpmsg_remove: closed rpmsg channel of slpi
[  467.659779] adsprpc: fastrpc_restart_notifier_cb: received RAMDUMP notification for slpi
[  467.661747] subsys-restart: subsystem_powerup(): [kworker/u19:0:2054]: Powering up slpi
[  467.661931] subsys-pil-tz 5c00000.qcom,ssc: slpi: loading from 0x0000000088c00000 to 0x000000008a600000
[  467.716145] subsys-pil-tz 5c00000.qcom,ssc: slpi: Brought out of reset
[  467.778657] subsys-pil-tz 5c00000.qcom,ssc: Subsystem error monitoring/handling services are up
[  467.778688] subsys-pil-tz 5c00000.qcom,ssc: slpi: Power/Clock ready interrupt received
[  467.778800] qcom_rpmh DRV:apps_rsc TCS Busy, retrying RPMH message send: addr=0x30040
[  467.786334] adsprpc: fastrpc_restart_notifier_cb: slpi subsystem is up
[  467.786340] subsys-restart: subsystem_restart_wq_func(): [kworker/u19:0:2054]: Restart sequence for slpi completed.
[  467.786864] 1118855912:Entered
[  467.787109] 1118855912:SMD QRTR driver probed
[  467.790948] adsprpc: fastrpc_rpmsg_probe: opened rpmsg channel for slpi
[  467.795012] sysmon-qmi: ssctl_new_server: Connection established between QMI handle and slpi's SSCTL service
[  467.795026] coresight-remote-etm soc:ssc_etm0: Connection established between QMI handle and 8 service
[  467.800505] diag: In diag_send_peripheral_buffering_mode, buffering flag not set for 3
[  469.020359] Fatal error on slpi!
[  469.020432] slpi subsystem failure reason: err_qdi.c:1079:EF:sensor_process:0x1:SNS_SEE_I_0:0x69:sns_stream_service.c:436:req_found.
[  469.020458] subsys-restart: subsystem_restart_dev(): Restart sequence requested for slpi, restart_level = RELATED.
[  469.022405] adsprpc: fastrpc_restart_notifier_cb: slpi subsystem is restarting
[  469.022408] subsys-restart: subsystem_shutdown(): [kworker/u19:0:2054]: Shutting down slpi
[  469.034300] qcom_rpmh DRV:apps_rsc TCS Busy, retrying RPMH message send: addr=0x30030
[  469.034318] qcom_rpmh DRV:apps_rsc TCS Busy, retrying RPMH message send: addr=0x30030
[  469.034337] qcom_rpmh DRV:apps_rsc TCS Busy, retrying RPMH message send: addr=0x30030
[  469.034348] qcom_rpmh DRV:apps_rsc TCS Busy, retrying RPMH message send: addr=0x30030
[  469.034360] qcom_rpmh DRV:apps_rsc TCS Busy, retrying RPMH message send: addr=0x30030
[  469.034371] qcom_rpmh DRV:apps_rsc TCS Busy, retrying RPMH message send: addr=0x30030
[  469.034382] qcom_rpmh DRV:apps_rsc TCS Busy, retrying RPMH message send: addr=0x30030
[  469.040876] coresight-remote-etm soc:ssc_etm0: Connection disconnected between QMI handle and 8 service
[  469.040986] sysmon-qmi: ssctl_del_server: Connection lost between QMI handle and slpi's SSCTL service
[  469.041166] adsprpc: fastrpc_rpmsg_remove: closed rpmsg channel of slpi
[  469.041336] adsprpc: fastrpc_restart_notifier_cb: received RAMDUMP notification for slpi
[  469.042154] subsys-restart: subsystem_powerup(): [kworker/u19:0:2054]: Powering up slpi
[  469.042336] subsys-pil-tz 5c00000.qcom,ssc: slpi: loading from 0x0000000088c00000 to 0x000000008a600000
[  469.101055] subsys-pil-tz 5c00000.qcom,ssc: slpi: Brought out of reset
[  469.161468] subsys-pil-tz 5c00000.qcom,ssc: Subsystem error monitoring/handling services are up
[  469.161515] subsys-pil-tz 5c00000.qcom,ssc: slpi: Power/Clock ready interrupt received
[  469.168694] adsprpc: fastrpc_restart_notifier_cb: slpi subsystem is up
[  469.168702] subsys-restart: subsystem_restart_wq_func(): [kworker/u19:0:2054]: Restart sequence for slpi completed.
[  469.168830] 1118855912:Entered
[  469.169190] 1118855912:SMD QRTR driver probed
[  469.170647] adsprpc: fastrpc_rpmsg_probe: opened rpmsg channel for slpi
[  469.177803] sysmon-qmi: ssctl_new_server: Connection established between QMI handle and slpi's SSCTL service
[  469.178019] coresight-remote-etm soc:ssc_etm0: Connection established between QMI handle and 8 service
[  469.183206] diag: In diag_send_peripheral_buffering_mode, buffering flag not set for 3
[  470.408342] Fatal error on slpi!
[  470.408426] slpi subsystem failure reason: err_qdi.c:1079:EF:sensor_process:0x1:SNS_SEE_I_0:0x69:sns_stream_service.c:436:req_found.
[  470.408454] subsys-restart: subsystem_restart_dev(): Restart sequence requested for slpi, restart_level = RELATED.
[  470.410929] adsprpc: fastrpc_restart_notifier_cb: slpi subsystem is restarting
[  470.410934] subsys-restart: subsystem_shutdown(): [kworker/u19:0:2054]: Shutting down slpi
[  470.428290] sysmon-qmi: ssctl_del_server: Connection lost between QMI handle and slpi's SSCTL service
[  470.428426] coresight-remote-etm soc:ssc_etm0: Connection disconnected between QMI handle and 8 service
[  470.430688] adsprpc: fastrpc_rpmsg_remove: closed rpmsg channel of slpi
[  470.430827] adsprpc: fastrpc_restart_notifier_cb: received RAMDUMP notification for slpi
[  470.431771] subsys-restart: subsystem_powerup(): [kworker/u19:0:2054]: Powering up slpi
[  470.431903] subsys-pil-tz 5c00000.qcom,ssc: slpi: loading from 0x0000000088c00000 to 0x000000008a600000
[  470.491572] subsys-pil-tz 5c00000.qcom,ssc: slpi: Brought out of reset
[  470.554485] subsys-pil-tz 5c00000.qcom,ssc: Subsystem error monitoring/handling services are up
[  470.554528] subsys-pil-tz 5c00000.qcom,ssc: slpi: Power/Clock ready interrupt received
[  470.561372] adsprpc: fastrpc_restart_notifier_cb: slpi subsystem is up
[  470.561377] subsys-restart: subsystem_restart_wq_func(): [kworker/u19:0:2054]: Restart sequence for slpi completed.
[  470.562108] 1118855912:Entered
[  470.562411] 1118855912:SMD QRTR driver probed
[  470.567554] adsprpc: fastrpc_rpmsg_probe: opened rpmsg channel for slpi
[  470.569456] sysmon-qmi: ssctl_new_server: Connection established between QMI handle and slpi's SSCTL service
[  470.569501] coresight-remote-etm soc:ssc_etm0: Connection established between QMI handle and 8 service
[  470.575413] diag: In diag_send_peripheral_buffering_mode, buffering flag not set for 3
[  471.808443] Fatal error on slpi!
[  471.808525] slpi subsystem failure reason: err_qdi.c:1079:EF:sensor_process:0x1:SNS_SEE_I_0:0x69:sns_stream_service.c:436:req_found.
[  471.808553] subsys-restart: subsystem_restart_dev(): Restart sequence requested for slpi, restart_level = RELATED.
[  471.811212] adsprpc: fastrpc_restart_notifier_cb: slpi subsystem is restarting
[  471.811217] subsys-restart: subsystem_shutdown(): [kworker/u19:0:2054]: Shutting down slpi
[  471.827600] coresight-remote-etm soc:ssc_etm0: Connection disconnected between QMI handle and 8 service
[  471.827611] sysmon-qmi: ssctl_del_server: Connection lost between QMI handle and slpi's SSCTL service
[  471.829473] adsprpc: fastrpc_rpmsg_remove: closed rpmsg channel of slpi
[  471.829658] adsprpc: fastrpc_restart_notifier_cb: received RAMDUMP notification for slpi
[  471.830216] subsys-restart: subsystem_powerup(): [kworker/u19:0:2054]: Powering up slpi
[  471.830370] subsys-pil-tz 5c00000.qcom,ssc: slpi: loading from 0x0000000088c00000 to 0x000000008a600000
[  471.885397] subsys-pil-tz 5c00000.qcom,ssc: slpi: Brought out of reset
[  471.947763] subsys-pil-tz 5c00000.qcom,ssc: Subsystem error monitoring/handling services are up
[  471.947797] subsys-pil-tz 5c00000.qcom,ssc: slpi: Power/Clock ready interrupt received
[  471.955860] adsprpc: fastrpc_restart_notifier_cb: slpi subsystem is up
[  471.955865] subsys-restart: subsystem_restart_wq_func(): [kworker/u19:0:2054]: Restart sequence for slpi completed.
[  471.957236] 1118855912:Entered
[  471.958811] 1118855912:SMD QRTR driver probed
[  471.959979] adsprpc: fastrpc_rpmsg_probe: opened rpmsg channel for slpi
[  471.962094] sysmon-qmi: ssctl_new_server: Connection established between QMI handle and slpi's SSCTL service
[  471.962128] coresight-remote-etm soc:ssc_etm0: Connection established between QMI handle and 8 service
[  471.969208] diag: In diag_send_peripheral_buffering_mode, buffering flag not set for 3
[  473.190744] Fatal error on slpi!
[  473.190818] slpi subsystem failure reason: err_qdi.c:1079:EF:sensor_process:0x1:SNS_SEE_I_0:0x69:sns_stream_service.c:436:req_found.
[  473.190843] subsys-restart: subsystem_restart_dev(): Restart sequence requested for slpi, restart_level = RELATED.
[  473.193872] adsprpc: fastrpc_restart_notifier_cb: slpi subsystem is restarting
[  473.193878] subsys-restart: subsystem_shutdown(): [kworker/u19:0:2054]: Shutting down slpi
[  473.205809] rpmh_rsc_send_data: 11 callbacks suppressed
[  473.205810] qcom_rpmh DRV:apps_rsc TCS Busy, retrying RPMH message send: addr=0x30030
[  473.205837] qcom_rpmh DRV:apps_rsc TCS Busy, retrying RPMH message send: addr=0x30040
[  473.206983] coresight-remote-etm soc:ssc_etm0: Connection disconnected between QMI handle and 8 service
[  473.206995] sysmon-qmi: ssctl_del_server: Connection lost between QMI handle and slpi's SSCTL service
[  473.207337] adsprpc: fastrpc_rpmsg_remove: closed rpmsg channel of slpi
[  473.210007] adsprpc: fastrpc_restart_notifier_cb: received RAMDUMP notification for slpi
[  473.210544] subsys-restart: subsystem_powerup(): [kworker/u19:0:2054]: Powering up slpi
[  473.211534] subsys-pil-tz 5c00000.qcom,ssc: slpi: loading from 0x0000000088c00000 to 0x000000008a600000
[  473.267488] subsys-pil-tz 5c00000.qcom,ssc: slpi: Brought out of reset
[  473.329966] subsys-pil-tz 5c00000.qcom,ssc: Subsystem error monitoring/handling services are up
[  473.330083] subsys-pil-tz 5c00000.qcom,ssc: slpi: Power/Clock ready interrupt received
[  473.337309] adsprpc: fastrpc_restart_notifier_cb: slpi subsystem is up
[  473.337313] subsys-restart: subsystem_restart_wq_func(): [kworker/u19:0:2054]: Restart sequence for slpi completed.
[  473.337774] 1118855912:Entered
[  473.338098] 1118855912:SMD QRTR driver probed
[  473.339277] adsprpc: fastrpc_rpmsg_probe: opened rpmsg channel for slpi
[  473.343685] sysmon-qmi: ssctl_new_server: Connection established between QMI handle and slpi's SSCTL service
[  473.343696] coresight-remote-etm soc:ssc_etm0: Connection established between QMI handle and 8 service
[  473.351954] diag: In diag_send_peripheral_buffering_mode, buffering flag not set for 3
[  474.571003] Fatal error on slpi!
[  474.571089] slpi subsystem failure reason: err_qdi.c:1079:EF:sensor_process:0x1:SNS_SEE_I_1:0x68:sns_stream_service.c:436:req_found.
[  474.571117] subsys-restart: subsystem_restart_dev(): Restart sequence requested for slpi, restart_level = RELATED.
[  474.574318] adsprpc: fastrpc_restart_notifier_cb: slpi subsystem is restarting
[  474.574322] subsys-restart: subsystem_shutdown(): [kworker/u19:0:2054]: Shutting down slpi
[  474.586295] qcom_rpmh DRV:apps_rsc TCS Busy, retrying RPMH message send: addr=0x30030
[  474.586323] qcom_rpmh DRV:apps_rsc TCS Busy, retrying RPMH message send: addr=0x30040
[  474.587793] coresight-remote-etm soc:ssc_etm0: Connection disconnected between QMI handle and 8 service
[  474.587808] sysmon-qmi: ssctl_del_server: Connection lost between QMI handle and slpi's SSCTL service
[  474.592474] adsprpc: fastrpc_rpmsg_remove: closed rpmsg channel of slpi
[  474.592629] adsprpc: fastrpc_restart_notifier_cb: received RAMDUMP notification for slpi
[  474.593885] subsys-restart: subsystem_powerup(): [kworker/u19:0:2054]: Powering up slpi
[  474.594047] subsys-pil-tz 5c00000.qcom,ssc: slpi: loading from 0x0000000088c00000 to 0x000000008a600000
[  474.648774] subsys-pil-tz 5c00000.qcom,ssc: slpi: Brought out of reset
[  474.710135] subsys-pil-tz 5c00000.qcom,ssc: Subsystem error monitoring/handling services are up
[  474.710177] subsys-pil-tz 5c00000.qcom,ssc: slpi: Power/Clock ready interrupt received
[  474.716090] 1118855912:Entered
[  474.716142] adsprpc: fastrpc_restart_notifier_cb: slpi subsystem is up
[  474.716147] subsys-restart: subsystem_restart_wq_func(): [kworker/u19:0:2054]: Restart sequence for slpi completed.
[  474.716593] 1118855912:SMD QRTR driver probed
[  474.718796] adsprpc: fastrpc_rpmsg_probe: opened rpmsg channel for slpi
[  474.724814] sysmon-qmi: ssctl_new_server: Connection established between QMI handle and slpi's SSCTL service
[  474.724833] coresight-remote-etm soc:ssc_etm0: Connection established between QMI handle and 8 service
[  474.730730] diag: In diag_send_peripheral_buffering_mode, buffering flag not set for 3
[  475.966509] Fatal error on slpi!
[  475.966596] slpi subsystem failure reason: err_qdi.c:1079:EF:sensor_process:0x1:SNS_SEE_I_1:0x68:sns_stream_service.c:436:req_found.
[  475.966624] subsys-restart: subsystem_restart_dev(): Restart sequence requested for slpi, restart_level = RELATED.
[  475.969220] adsprpc: fastrpc_restart_notifier_cb: slpi subsystem is restarting
[  475.969224] subsys-restart: subsystem_shutdown(): [kworker/u19:0:2054]: Shutting down slpi
[  475.981165] qcom_rpmh DRV:apps_rsc TCS Busy, retrying RPMH message send: addr=0x30030
[  475.981191] qcom_rpmh DRV:apps_rsc TCS Busy, retrying RPMH message send: addr=0x30040
[  475.983399] coresight-remote-etm soc:ssc_etm0: Connection disconnected between QMI handle and 8 service
[  475.983410] sysmon-qmi: ssctl_del_server: Connection lost between QMI handle and slpi's SSCTL service
[  475.987724] adsprpc: fastrpc_rpmsg_remove: closed rpmsg channel of slpi
[  475.987865] adsprpc: fastrpc_restart_notifier_cb: received RAMDUMP notification for slpi
[  475.989595] subsys-restart: subsystem_powerup(): [kworker/u19:0:2054]: Powering up slpi
[  475.989762] subsys-pil-tz 5c00000.qcom,ssc: slpi: loading from 0x0000000088c00000 to 0x000000008a600000
[  476.047626] subsys-pil-tz 5c00000.qcom,ssc: slpi: Brought out of reset
[  476.107799] subsys-pil-tz 5c00000.qcom,ssc: Subsystem error monitoring/handling services are up
[  476.107835] subsys-pil-tz 5c00000.qcom,ssc: slpi: Power/Clock ready interrupt received
[  476.114130] adsprpc: fastrpc_restart_notifier_cb: slpi subsystem is up
[  476.114135] subsys-restart: subsystem_restart_wq_func(): [kworker/u19:0:2054]: Restart sequence for slpi completed.
[  476.116482] 1118855912:Entered
[  476.119264] 1118855912:SMD QRTR driver probed
[  476.121677] adsprpc: fastrpc_rpmsg_probe: opened rpmsg channel for slpi
[  476.122117] sysmon-qmi: ssctl_new_server: Connection established between QMI handle and slpi's SSCTL service
[  476.122133] coresight-remote-etm soc:ssc_etm0: Connection established between QMI handle and 8 service
[  476.130800] diag: In diag_send_peripheral_buffering_mode, buffering flag not set for 3
[  477.367311] Fatal error on slpi!
[  477.367394] slpi subsystem failure reason: err_qdi.c:1079:EF:sensor_process:0x1:SNS_SEE_I_1:0x68:sns_stream_service.c:436:req_found.
[  477.367420] subsys-restart: subsystem_restart_dev(): Restart sequence requested for slpi, restart_level = RELATED.
[  477.370476] adsprpc: fastrpc_restart_notifier_cb: slpi subsystem is restarting
[  477.370480] subsys-restart: subsystem_shutdown(): [kworker/u19:0:2054]: Shutting down slpi
[  477.382395] qcom_rpmh DRV:apps_rsc TCS Busy, retrying RPMH message send: addr=0x30030
[  477.382419] qcom_rpmh DRV:apps_rsc TCS Busy, retrying RPMH message send: addr=0x30040
[  477.383806] coresight-remote-etm soc:ssc_etm0: Connection disconnected between QMI handle and 8 service
[  477.383817] sysmon-qmi: ssctl_del_server: Connection lost between QMI handle and slpi's SSCTL service
[  477.384136] adsprpc: fastrpc_rpmsg_remove: closed rpmsg channel of slpi
[  477.384263] adsprpc: fastrpc_restart_notifier_cb: received RAMDUMP notification for slpi
[  477.384816] subsys-restart: subsystem_powerup(): [kworker/u19:0:2054]: Powering up slpi
[  477.385120] subsys-pil-tz 5c00000.qcom,ssc: slpi: loading from 0x0000000088c00000 to 0x000000008a600000
[  477.443490] subsys-pil-tz 5c00000.qcom,ssc: slpi: Brought out of reset
[  477.506162] subsys-pil-tz 5c00000.qcom,ssc: Subsystem error monitoring/handling services are up
[  477.506193] subsys-pil-tz 5c00000.qcom,ssc: slpi: Power/Clock ready interrupt received
[  477.506290] qcom_rpmh DRV:apps_rsc TCS Busy, retrying RPMH message send: addr=0x30040
[  477.512803] 1118855912:Entered
[  477.513075] adsprpc: fastrpc_restart_notifier_cb: slpi subsystem is up
[  477.513079] subsys-restart: subsystem_restart_wq_func(): [kworker/u19:0:2054]: Restart sequence for slpi completed.
[  477.513148] 1118855912:SMD QRTR driver probed
[  477.515628] adsprpc: fastrpc_rpmsg_probe: opened rpmsg channel for slpi
[  477.521213] sysmon-qmi: ssctl_new_server: Connection established between QMI handle and slpi's SSCTL service
[  477.521250] coresight-remote-etm soc:ssc_etm0: Connection established between QMI handle and 8 service
[  477.525781] diag: In diag_send_peripheral_buffering_mode, buffering flag not set for 3
[  503.375461] Fatal error on slpi!
[  503.375541] slpi subsystem failure reason: err_qdi.c:1079:EF:sensor_process:0x1:SNS_SEE_I_1:0x68:sns_stream_service.c:436:req_found.
[  503.375566] subsys-restart: subsystem_restart_dev(): Restart sequence requested for slpi, restart_level = RELATED.
[  503.378697] adsprpc: fastrpc_restart_notifier_cb: slpi subsystem is restarting
[  503.378700] subsys-restart: subsystem_shutdown(): [kworker/u19:0:2054]: Shutting down slpi
[  503.390607] qcom_rpmh DRV:apps_rsc TCS Busy, retrying RPMH message send: addr=0x30030
[  503.390638] qcom_rpmh DRV:apps_rsc TCS Busy, retrying RPMH message send: addr=0x30040
[  503.391897] coresight-remote-etm soc:ssc_etm0: Connection disconnected between QMI handle and 8 service
[  503.391976] sysmon-qmi: ssctl_del_server: Connection lost between QMI handle and slpi's SSCTL service
[  503.392269] adsprpc: fastrpc_rpmsg_remove: closed rpmsg channel of slpi
[  503.393461] adsprpc: fastrpc_restart_notifier_cb: received RAMDUMP notification for slpi
[  503.394021] subsys-restart: subsystem_powerup(): [kworker/u19:0:2054]: Powering up slpi
[  503.394144] subsys-pil-tz 5c00000.qcom,ssc: slpi: loading from 0x0000000088c00000 to 0x000000008a600000
[  503.455432] subsys-pil-tz 5c00000.qcom,ssc: slpi: Brought out of reset
[  503.515539] subsys-pil-tz 5c00000.qcom,ssc: Subsystem error monitoring/handling services are up
[  503.515566] subsys-pil-tz 5c00000.qcom,ssc: slpi: Power/Clock ready interrupt received
[  503.521829] 1118855912:Entered
[  503.521855] adsprpc: fastrpc_restart_notifier_cb: slpi subsystem is up
[  503.521861] subsys-restart: subsystem_restart_wq_func(): [kworker/u19:0:2054]: Restart sequence for slpi completed.
[  503.522191] 1118855912:SMD QRTR driver probed
[  503.523845] adsprpc: fastrpc_rpmsg_probe: opened rpmsg channel for slpi
[  503.530404] sysmon-qmi: ssctl_new_server: Connection established between QMI handle and slpi's SSCTL service
[  503.530421] coresight-remote-etm soc:ssc_etm0: Connection established between QMI handle and 8 service
[  503.535973] diag: In diag_send_peripheral_buffering_mode, buffering flag not set for 3
[  928.349273] perf: interrupt took too long (2502 > 2500), lowering kernel.perf_event_max_sample_rate to 79750

[ 1413.270080] perf: interrupt took too long (3128 > 3127), lowering kernel.perf_event_max_sample_rate to 63750
[ 2701.369922] perf: interrupt took too long (3915 > 3910), lowering kernel.perf_event_max_sample_rate to 51000
FCv2 QGC mavlink status when communication working
nsh> mavlink status

instance #0:
    mavlink chan: #0
    type:        GENERIC LINK OR RADIO
    flow control: OFF
    rates:
      tx: 1322.9 B/s
      txerr: 0.0 B/s
      tx rate mult: 0.050
      tx rate max: 1200 B/s
      rx: 4758.9 B/s
      rx loss: 128.0%
    Received Messages:
      sysid:  1, compid:197, Total: 3287 (lost: 425347)
        msgid:    0, Rate:  0.3 Hz, last 0.15s ago
        msgid:  330, Rate:  7.3 Hz, last 0.18s ago
        msgid:  331, Rate: 12.1 Hz, last 0.05s ago
        msgid:   84, Rate: 11.6 Hz, last 0.08s ago
      sysid:  1, compid:196, Total: 37 (lost: 0)
        msgid:    0, Rate:  0.3 Hz, last 2.44s ago
    FTP enabled: YES, TX enabled: YES
    mode: Onboard
    Forwarding: On
    MAVLink version: 2
    transport protocol: serial (/dev/ttyS6 @115200)
FCv2 QGC mavlink status when "connection to mission computer lost"
mavlink status

instance #0:
    mavlink chan: #0
    type:        GENERIC LINK OR RADIO
    flow control: OFF
    rates:
      tx: 1621.3 B/s
      txerr: 0.0 B/s
      tx rate mult: 0.050
      tx rate max: 1200 B/s
      rx: 0.0 B/s
      rx loss: 125.6%
    Received Messages:
      sysid:  1, compid:197, Total: 6025 (lost: 765633)
      sysid:  1, compid:196, Total: 69 (lost: 0)
    FTP enabled: YES, TX enabled: YES
    mode: Onboard
    Forwarding: On
    MAVLink version: 2
    transport protocol: serial (/dev/ttyS6 @115200)
Please update if J18 is usable or not for MAVLink?
- MAVLink connections are getting lost in a few minutes.
-
I am testing with J18(VOXl2) and J1(TELEM1) port.
Seems SLPI is throwing a lot of errors in demsg.
and @115200 buadrate.- MAVLink connections are getting lost in a few minutes.
and getting rx loss of 124% on FCv2 QGC.
Can you let me know if the J18 DSP port is buggy or how to fix these errors?
After a few minutes or a few restarts of VOXl-mavlink-server. it stops working and shows an error and exitsCouldn't locate SUID for flight_controller Failed to detect flight controller sensor ERROR: fc_sensor_initialize failed ERROR: Failed to initialize slpi ERROR: Encountered error while initializing bus 12 ERROR: Unable to configure bus 12 (baudrate 115200) with voxl_io Stopping autopilot io module Stopping gcs io module Stopping pipe io module closing remaining client pipes closing remaining server pipes Removing PID file exiting====> dmesg log while voxl-mavlink-server running stopped working and throwing an error when starting
[  460.730018] adsprpc: fastrpc_restart_notifier_cb: received RAMDUMP notification for slpi
[  460.730717] subsys-restart: subsystem_powerup(): [kworker/u19:0:2054]: Powering up slpi
[  460.730901] subsys-pil-tz 5c00000.qcom,ssc: slpi: loading from 0x0000000088c00000 to 0x000000008a600000
[  460.790600] subsys-pil-tz 5c00000.qcom,ssc: slpi: Brought out of reset
[  460.853124] subsys-pil-tz 5c00000.qcom,ssc: Subsystem error monitoring/handling services are up
[  460.853154] subsys-pil-tz 5c00000.qcom,ssc: slpi: Power/Clock ready interrupt received
[  460.860922] adsprpc: fastrpc_restart_notifier_cb: slpi subsystem is up
[  460.860928] subsys-restart: subsystem_restart_wq_func(): [kworker/u19:0:2054]: Restart sequence for slpi completed.
[  460.861499] 1118855912:Entered
[  460.861942] 1118855912:SMD QRTR driver probed
[  460.862983] adsprpc: fastrpc_rpmsg_probe: opened rpmsg channel for slpi
[  460.866169] sysmon-qmi: ssctl_new_server: Connection established between QMI handle and slpi's SSCTL service
[  460.866208] coresight-remote-etm soc:ssc_etm0: Connection established between QMI handle and 8 service
[  460.874694] diag: In diag_send_peripheral_buffering_mode, buffering flag not set for 3
[  462.106273] Fatal error on slpi!
[  462.106348] slpi subsystem failure reason: err_qdi.c:1079:EF:sensor_process:0x1:SNS_SEE_I_1:0x68:sns_stream_service.c:436:req_found.
[  462.106375] subsys-restart: subsystem_restart_dev(): Restart sequence requested for slpi, restart_level = RELATED.
[  462.108414] adsprpc: fastrpc_restart_notifier_cb: slpi subsystem is restarting
[  462.108416] subsys-restart: subsystem_shutdown(): [kworker/u19:0:2054]: Shutting down slpi
[  462.120395] rpmh_rsc_send_data: 17 callbacks suppressed
[  462.120396] qcom_rpmh DRV:apps_rsc TCS Busy, retrying RPMH message send: addr=0x30030
[  462.120423] qcom_rpmh DRV:apps_rsc TCS Busy, retrying RPMH message send: addr=0x30040
[  462.121677] coresight-remote-etm soc:ssc_etm0: Connection disconnected between QMI handle and 8 service
[  462.121691] sysmon-qmi: ssctl_del_server: Connection lost between QMI handle and slpi's SSCTL service
[  462.122027] adsprpc: fastrpc_rpmsg_remove: closed rpmsg channel of slpi
[  462.122151] adsprpc: fastrpc_restart_notifier_cb: received RAMDUMP notification for slpi
[  462.122757] subsys-restart: subsystem_powerup(): [kworker/u19:0:2054]: Powering up slpi
[  462.122886] subsys-pil-tz 5c00000.qcom,ssc: slpi: loading from 0x0000000088c00000 to 0x000000008a600000
[  462.178193] subsys-pil-tz 5c00000.qcom,ssc: slpi: Brought out of reset
[  462.240639] subsys-pil-tz 5c00000.qcom,ssc: Subsystem error monitoring/handling services are up
[  462.240671] subsys-pil-tz 5c00000.qcom,ssc: slpi: Power/Clock ready interrupt received
[  462.240789] qcom_rpmh DRV:apps_rsc TCS Busy, retrying RPMH message send: addr=0x30040
[  462.247665] 1118855912:Entered
[  462.248151] adsprpc: fastrpc_restart_notifier_cb: slpi subsystem is up
[  462.248158] subsys-restart: subsystem_restart_wq_func(): [kworker/u19:0:2054]: Restart sequence for slpi completed.
[  462.249366] 1118855912:SMD QRTR driver probed
[  462.252554] adsprpc: fastrpc_rpmsg_probe: opened rpmsg channel for slpi
[  462.254897] sysmon-qmi: ssctl_new_server: Connection established between QMI handle and slpi's SSCTL service
[  462.254962] coresight-remote-etm soc:ssc_etm0: Connection established between QMI handle and 8 service
[  462.261500] diag: In diag_send_peripheral_buffering_mode, buffering flag not set for 3
[  463.481618] Fatal error on slpi!
[  463.481694] slpi subsystem failure reason: err_qdi.c:1079:EF:sensor_process:0x1:SNS_SEE_I_1:0x68:sns_stream_service.c:436:req_found.
[  463.481720] subsys-restart: subsystem_restart_dev(): Restart sequence requested for slpi, restart_level = RELATED.
[  463.483312] adsprpc: fastrpc_restart_notifier_cb: slpi subsystem is restarting
[  463.483315] subsys-restart: subsystem_shutdown(): [kworker/u19:0:2054]: Shutting down slpi
[  463.495481] qcom_rpmh DRV:apps_rsc TCS Busy, retrying RPMH message send: addr=0x30030
[  463.495494] qcom_rpmh DRV:apps_rsc TCS Busy, retrying RPMH message send: addr=0x30030
[  463.495505] qcom_rpmh DRV:apps_rsc TCS Busy, retrying RPMH message send: addr=0x30030
[  463.495516] qcom_rpmh DRV:apps_rsc TCS Busy, retrying RPMH message send: addr=0x30030
[  463.495528] qcom_rpmh DRV:apps_rsc TCS Busy, retrying RPMH message send: addr=0x30030
[  463.495539] qcom_rpmh DRV:apps_rsc TCS Busy, retrying RPMH message send: addr=0x30030
[  463.495551] qcom_rpmh DRV:apps_rsc TCS Busy, retrying RPMH message send: addr=0x30030
[  463.498539] coresight-remote-etm soc:ssc_etm0: Connection disconnected between QMI handle and 8 service
[  463.498548] sysmon-qmi: ssctl_del_server: Connection lost between QMI handle and slpi's SSCTL service
[  463.498944] adsprpc: fastrpc_rpmsg_remove: closed rpmsg channel of slpi
[  463.499294] adsprpc: fastrpc_restart_notifier_cb: received RAMDUMP notification for slpi
[  463.499834] subsys-restart: subsystem_powerup(): [kworker/u19:0:2054]: Powering up slpi
[  463.499987] subsys-pil-tz 5c00000.qcom,ssc: slpi: loading from 0x0000000088c00000 to 0x000000008a600000
[  463.558705] subsys-pil-tz 5c00000.qcom,ssc: slpi: Brought out of reset
[  463.619354] subsys-pil-tz 5c00000.qcom,ssc: Subsystem error monitoring/handling services are up
[  463.619389] subsys-pil-tz 5c00000.qcom,ssc: slpi: Power/Clock ready interrupt received
[  463.626313] adsprpc: fastrpc_restart_notifier_cb: slpi subsystem is up
[  463.626319] subsys-restart: subsystem_restart_wq_func(): [kworker/u19:0:2054]: Restart sequence for slpi completed.
[  463.629242] 1118855912:Entered
[  463.631383] 1118855912:SMD QRTR driver probed
[  463.633320] sysmon-qmi: ssctl_new_server: Connection established between QMI handle and slpi's SSCTL service
[  463.633334] coresight-remote-etm soc:ssc_etm0: Connection established between QMI handle and 8 service
[  463.633688] adsprpc: fastrpc_rpmsg_probe: opened rpmsg channel for slpi
[  463.641981] diag: In diag_send_peripheral_buffering_mode, buffering flag not set for 3
[  464.864191] Fatal error on slpi!
[  464.864266] slpi subsystem failure reason: err_qdi.c:1079:EF:sensor_process:0x1:SNS_SEE_I_0:0x69:sns_stream_service.c:436:req_found.
[  464.864291] subsys-restart: subsystem_restart_dev(): Restart sequence requested for slpi, restart_level = RELATED.
[  464.867315] adsprpc: fastrpc_restart_notifier_cb: slpi subsystem is restarting
[  464.867320] subsys-restart: subsystem_shutdown(): [kworker/u19:0:2054]: Shutting down slpi
[  464.883697] coresight-remote-etm soc:ssc_etm0: Connection disconnected between QMI handle and 8 service
[  464.883706] sysmon-qmi: ssctl_del_server: Connection lost between QMI handle and slpi's SSCTL service
[  464.885643] adsprpc: fastrpc_rpmsg_remove: closed rpmsg channel of slpi
[  464.885787] adsprpc: fastrpc_restart_notifier_cb: received RAMDUMP notification for slpi
[  464.887190] subsys-restart: subsystem_powerup(): [kworker/u19:0:2054]: Powering up slpi
[  464.887455] subsys-pil-tz 5c00000.qcom,ssc: slpi: loading from 0x0000000088c00000 to 0x000000008a600000
[  464.945581] subsys-pil-tz 5c00000.qcom,ssc: slpi: Brought out of reset
[  465.007996] subsys-pil-tz 5c00000.qcom,ssc: Subsystem error monitoring/handling services are up
[  465.008139] subsys-pil-tz 5c00000.qcom,ssc: slpi: Power/Clock ready interrupt received
[  465.015414] adsprpc: fastrpc_restart_notifier_cb: slpi subsystem is up
[  465.015420] subsys-restart: subsystem_restart_wq_func(): [kworker/u19:0:2054]: Restart sequence for slpi completed.
[  465.015924] 1118855912:Entered
[  465.016498] 1118855912:SMD QRTR driver probed
[  465.019954] adsprpc: fastrpc_rpmsg_probe: opened rpmsg channel for slpi
[  465.023578] sysmon-qmi: ssctl_new_server: Connection established between QMI handle and slpi's SSCTL service
[  465.023627] coresight-remote-etm soc:ssc_etm0: Connection established between QMI handle and 8 service
[  465.029301] diag: In diag_send_peripheral_buffering_mode, buffering flag not set for 3
[  466.256347] Fatal error on slpi!
[  466.256432] slpi subsystem failure reason: err_qdi.c:1079:EF:sensor_process:0x1:SNS_SEE_I_0:0x69:sns_stream_service.c:436:req_found.
[  466.256456] subsys-restart: subsystem_restart_dev(): Restart sequence requested for slpi, restart_level = RELATED.
[  466.259074] adsprpc: fastrpc_restart_notifier_cb: slpi subsystem is restarting
[  466.259079] subsys-restart: subsystem_shutdown(): [kworker/u19:0:2054]: Shutting down slpi
[  466.275522] coresight-remote-etm soc:ssc_etm0: Connection disconnected between QMI handle and 8 service
[  466.275806] sysmon-qmi: ssctl_del_server: Connection lost between QMI handle and slpi's SSCTL service
[  466.277897] adsprpc: fastrpc_rpmsg_remove: closed rpmsg channel of slpi
[  466.278247] adsprpc: fastrpc_restart_notifier_cb: received RAMDUMP notification for slpi
[  466.279336] subsys-restart: subsystem_powerup(): [kworker/u19:0:2054]: Powering up slpi
[  466.279500] subsys-pil-tz 5c00000.qcom,ssc: slpi: loading from 0x0000000088c00000 to 0x000000008a600000
[  466.338642] subsys-pil-tz 5c00000.qcom,ssc: slpi: Brought out of reset
[  466.399095] subsys-pil-tz 5c00000.qcom,ssc: Subsystem error monitoring/handling services are up
[  466.399127] subsys-pil-tz 5c00000.qcom,ssc: slpi: Power/Clock ready interrupt received
[  466.405824] adsprpc: fastrpc_restart_notifier_cb: slpi subsystem is up
[  466.405830] 1118855912:Entered
[  466.405832] subsys-restart: subsystem_restart_wq_func(): [kworker/u19:0:2054]: Restart sequence for slpi completed.
[  466.406031] 1118855912:SMD QRTR driver probed
[  466.407495] adsprpc: fastrpc_rpmsg_probe: opened rpmsg channel for slpi
[  466.411445] coresight-remote-etm soc:ssc_etm0: Connection established between QMI handle and 8 service
[  466.412552] sysmon-qmi: ssctl_new_server: Connection established between QMI handle and slpi's SSCTL service
[  466.419864] diag: In diag_send_peripheral_buffering_mode, buffering flag not set for 3
[  467.641878] Fatal error on slpi!
[  467.641957] slpi subsystem failure reason: err_qdi.c:1079:EF:sensor_process:0x1:SNS_SEE_I_1:0x68:sns_stream_service.c:436:req_found.
[  467.641983] subsys-restart: subsystem_restart_dev(): Restart sequence requested for slpi, restart_level = RELATED.
[  467.644997] adsprpc: fastrpc_restart_notifier_cb: slpi subsystem is restarting
[  467.645001] subsys-restart: subsystem_shutdown(): [kworker/u19:0:2054]: Shutting down slpi
[  467.656914] rpmh_rsc_send_data: 19 callbacks suppressed
[  467.656915] qcom_rpmh DRV:apps_rsc TCS Busy, retrying RPMH message send: addr=0x30030
[  467.656940] qcom_rpmh DRV:apps_rsc TCS Busy, retrying RPMH message send: addr=0x30040
[  467.658270] coresight-remote-etm soc:ssc_etm0: Connection disconnected between QMI handle and 8 service
[  467.658280] sysmon-qmi: ssctl_del_server: Connection lost between QMI handle and slpi's SSCTL service
[  467.658668] adsprpc: fastrpc_rpmsg_remove: closed rpmsg channel of slpi
[  467.659779] adsprpc: fastrpc_restart_notifier_cb: received RAMDUMP notification for slpi
[  467.661747] subsys-restart: subsystem_powerup(): [kworker/u19:0:2054]: Powering up slpi
[  467.661931] subsys-pil-tz 5c00000.qcom,ssc: slpi: loading from 0x0000000088c00000 to 0x000000008a600000
[  467.716145] subsys-pil-tz 5c00000.qcom,ssc: slpi: Brought out of reset
[  467.778657] subsys-pil-tz 5c00000.qcom,ssc: Subsystem error monitoring/handling services are up
[  467.778688] subsys-pil-tz 5c00000.qcom,ssc: slpi: Power/Clock ready interrupt received
[  467.778800] qcom_rpmh DRV:apps_rsc TCS Busy, retrying RPMH message send: addr=0x30040
[  467.786334] adsprpc: fastrpc_restart_notifier_cb: slpi subsystem is up
[  467.786340] subsys-restart: subsystem_restart_wq_func(): [kworker/u19:0:2054]: Restart sequence for slpi completed.
[  467.786864] 1118855912:Entered
[  467.787109] 1118855912:SMD QRTR driver probed
[  467.790948] adsprpc: fastrpc_rpmsg_probe: opened rpmsg channel for slpi
[  467.795012] sysmon-qmi: ssctl_new_server: Connection established between QMI handle and slpi's SSCTL service
[  467.795026] coresight-remote-etm soc:ssc_etm0: Connection established between QMI handle and 8 service
[  467.800505] diag: In diag_send_peripheral_buffering_mode, buffering flag not set for 3
[  469.020359] Fatal error on slpi!
[  469.020432] slpi subsystem failure reason: err_qdi.c:1079:EF:sensor_process:0x1:SNS_SEE_I_0:0x69:sns_stream_service.c:436:req_found.
[  469.020458] subsys-restart: subsystem_restart_dev(): Restart sequence requested for slpi, restart_level = RELATED.
[  469.022405] adsprpc: fastrpc_restart_notifier_cb: slpi subsystem is restarting
[  469.022408] subsys-restart: subsystem_shutdown(): [kworker/u19:0:2054]: Shutting down slpi
[  469.034300] qcom_rpmh DRV:apps_rsc TCS Busy, retrying RPMH message send: addr=0x30030
[  469.034318] qcom_rpmh DRV:apps_rsc TCS Busy, retrying RPMH message send: addr=0x30030
[  469.034337] qcom_rpmh DRV:apps_rsc TCS Busy, retrying RPMH message send: addr=0x30030
[  469.034348] qcom_rpmh DRV:apps_rsc TCS Busy, retrying RPMH message send: addr=0x30030
[  469.034360] qcom_rpmh DRV:apps_rsc TCS Busy, retrying RPMH message send: addr=0x30030
[  469.034371] qcom_rpmh DRV:apps_rsc TCS Busy, retrying RPMH message send: addr=0x30030
[  469.034382] qcom_rpmh DRV:apps_rsc TCS Busy, retrying RPMH message send: addr=0x30030
[  469.040876] coresight-remote-etm soc:ssc_etm0: Connection disconnected between QMI handle and 8 service
[  469.040986] sysmon-qmi: ssctl_del_server: Connection lost between QMI handle and slpi's SSCTL service
[  469.041166] adsprpc: fastrpc_rpmsg_remove: closed rpmsg channel of slpi
[  469.041336] adsprpc: fastrpc_restart_notifier_cb: received RAMDUMP notification for slpi
[  469.042154] subsys-restart: subsystem_powerup(): [kworker/u19:0:2054]: Powering up slpi
[  469.042336] subsys-pil-tz 5c00000.qcom,ssc: slpi: loading from 0x0000000088c00000 to 0x000000008a600000
[  469.101055] subsys-pil-tz 5c00000.qcom,ssc: slpi: Brought out of reset
[  469.161468] subsys-pil-tz 5c00000.qcom,ssc: Subsystem error monitoring/handling services are up
[  469.161515] subsys-pil-tz 5c00000.qcom,ssc: slpi: Power/Clock ready interrupt received
[  469.168694] adsprpc: fastrpc_restart_notifier_cb: slpi subsystem is up
[  469.168702] subsys-restart: subsystem_restart_wq_func(): [kworker/u19:0:2054]: Restart sequence for slpi completed.
[  469.168830] 1118855912:Entered
[  469.169190] 1118855912:SMD QRTR driver probed
[  469.170647] adsprpc: fastrpc_rpmsg_probe: opened rpmsg channel for slpi
[  469.177803] sysmon-qmi: ssctl_new_server: Connection established between QMI handle and slpi's SSCTL service
[  469.178019] coresight-remote-etm soc:ssc_etm0: Connection established between QMI handle and 8 service
[  469.183206] diag: In diag_send_peripheral_buffering_mode, buffering flag not set for 3
[  470.408342] Fatal error on slpi!
[  470.408426] slpi subsystem failure reason: err_qdi.c:1079:EF:sensor_process:0x1:SNS_SEE_I_0:0x69:sns_stream_service.c:436:req_found.
[  470.408454] subsys-restart: subsystem_restart_dev(): Restart sequence requested for slpi, restart_level = RELATED.
[  470.410929] adsprpc: fastrpc_restart_notifier_cb: slpi subsystem is restarting
[  470.410934] subsys-restart: subsystem_shutdown(): [kworker/u19:0:2054]: Shutting down slpi
[  470.428290] sysmon-qmi: ssctl_del_server: Connection lost between QMI handle and slpi's SSCTL service
[  470.428426] coresight-remote-etm soc:ssc_etm0: Connection disconnected between QMI handle and 8 service
[  470.430688] adsprpc: fastrpc_rpmsg_remove: closed rpmsg channel of slpi
[  470.430827] adsprpc: fastrpc_restart_notifier_cb: received RAMDUMP notification for slpi
[  470.431771] subsys-restart: subsystem_powerup(): [kworker/u19:0:2054]: Powering up slpi
[  470.431903] subsys-pil-tz 5c00000.qcom,ssc: slpi: loading from 0x0000000088c00000 to 0x000000008a600000
[  470.491572] subsys-pil-tz 5c00000.qcom,ssc: slpi: Brought out of reset
[  470.554485] subsys-pil-tz 5c00000.qcom,ssc: Subsystem error monitoring/handling services are up
[  470.554528] subsys-pil-tz 5c00000.qcom,ssc: slpi: Power/Clock ready interrupt received
[  470.561372] adsprpc: fastrpc_restart_notifier_cb: slpi subsystem is up
[  470.561377] subsys-restart: subsystem_restart_wq_func(): [kworker/u19:0:2054]: Restart sequence for slpi completed.
[  470.562108] 1118855912:Entered
[  470.562411] 1118855912:SMD QRTR driver probed
[  470.567554] adsprpc: fastrpc_rpmsg_probe: opened rpmsg channel for slpi
[  470.569456] sysmon-qmi: ssctl_new_server: Connection established between QMI handle and slpi's SSCTL service
[  470.569501] coresight-remote-etm soc:ssc_etm0: Connection established between QMI handle and 8 service
[  470.575413] diag: In diag_send_peripheral_buffering_mode, buffering flag not set for 3
[  471.808443] Fatal error on slpi!
[  471.808525] slpi subsystem failure reason: err_qdi.c:1079:EF:sensor_process:0x1:SNS_SEE_I_0:0x69:sns_stream_service.c:436:req_found.
[  471.808553] subsys-restart: subsystem_restart_dev(): Restart sequence requested for slpi, restart_level = RELATED.
[  471.811212] adsprpc: fastrpc_restart_notifier_cb: slpi subsystem is restarting
[  471.811217] subsys-restart: subsystem_shutdown(): [kworker/u19:0:2054]: Shutting down slpi
[  471.827600] coresight-remote-etm soc:ssc_etm0: Connection disconnected between QMI handle and 8 service
[  471.827611] sysmon-qmi: ssctl_del_server: Connection lost between QMI handle and slpi's SSCTL service
[  471.829473] adsprpc: fastrpc_rpmsg_remove: closed rpmsg channel of slpi
[  471.829658] adsprpc: fastrpc_restart_notifier_cb: received RAMDUMP notification for slpi
[  471.830216] subsys-restart: subsystem_powerup(): [kworker/u19:0:2054]: Powering up slpi
[  471.830370] subsys-pil-tz 5c00000.qcom,ssc: slpi: loading from 0x0000000088c00000 to 0x000000008a600000
[  471.885397] subsys-pil-tz 5c00000.qcom,ssc: slpi: Brought out of reset
[  471.947763] subsys-pil-tz 5c00000.qcom,ssc: Subsystem error monitoring/handling services are up
[  471.947797] subsys-pil-tz 5c00000.qcom,ssc: slpi: Power/Clock ready interrupt received
[  471.955860] adsprpc: fastrpc_restart_notifier_cb: slpi subsystem is up
[  471.955865] subsys-restart: subsystem_restart_wq_func(): [kworker/u19:0:2054]: Restart sequence for slpi completed.
[  471.957236] 1118855912:Entered
[  471.958811] 1118855912:SMD QRTR driver probed
[  471.959979] adsprpc: fastrpc_rpmsg_probe: opened rpmsg channel for slpi
[  471.962094] sysmon-qmi: ssctl_new_server: Connection established between QMI handle and slpi's SSCTL service
[  471.962128] coresight-remote-etm soc:ssc_etm0: Connection established between QMI handle and 8 service
[  471.969208] diag: In diag_send_peripheral_buffering_mode, buffering flag not set for 3
[  473.190744] Fatal error on slpi!
[  473.190818] slpi subsystem failure reason: err_qdi.c:1079:EF:sensor_process:0x1:SNS_SEE_I_0:0x69:sns_stream_service.c:436:req_found.
[  473.190843] subsys-restart: subsystem_restart_dev(): Restart sequence requested for slpi, restart_level = RELATED.
[  473.193872] adsprpc: fastrpc_restart_notifier_cb: slpi subsystem is restarting
[  473.193878] subsys-restart: subsystem_shutdown(): [kworker/u19:0:2054]: Shutting down slpi
[  473.205809] rpmh_rsc_send_data: 11 callbacks suppressed
[  473.205810] qcom_rpmh DRV:apps_rsc TCS Busy, retrying RPMH message send: addr=0x30030
[  473.205837] qcom_rpmh DRV:apps_rsc TCS Busy, retrying RPMH message send: addr=0x30040
[  473.206983] coresight-remote-etm soc:ssc_etm0: Connection disconnected between QMI handle and 8 service
[  473.206995] sysmon-qmi: ssctl_del_server: Connection lost between QMI handle and slpi's SSCTL service
[  473.207337] adsprpc: fastrpc_rpmsg_remove: closed rpmsg channel of slpi
[  473.210007] adsprpc: fastrpc_restart_notifier_cb: received RAMDUMP notification for slpi
[  473.210544] subsys-restart: subsystem_powerup(): [kworker/u19:0:2054]: Powering up slpi
[  473.211534] subsys-pil-tz 5c00000.qcom,ssc: slpi: loading from 0x0000000088c00000 to 0x000000008a600000
[  473.267488] subsys-pil-tz 5c00000.qcom,ssc: slpi: Brought out of reset
[  473.329966] subsys-pil-tz 5c00000.qcom,ssc: Subsystem error monitoring/handling services are up
[  473.330083] subsys-pil-tz 5c00000.qcom,ssc: slpi: Power/Clock ready interrupt received
[  473.337309] adsprpc: fastrpc_restart_notifier_cb: slpi subsystem is up
[  473.337313] subsys-restart: subsystem_restart_wq_func(): [kworker/u19:0:2054]: Restart sequence for slpi completed.
[  473.337774] 1118855912:Entered
[  473.338098] 1118855912:SMD QRTR driver probed
[  473.339277] adsprpc: fastrpc_rpmsg_probe: opened rpmsg channel for slpi
[  473.343685] sysmon-qmi: ssctl_new_server: Connection established between QMI handle and slpi's SSCTL service
[  473.343696] coresight-remote-etm soc:ssc_etm0: Connection established between QMI handle and 8 service
[  473.351954] diag: In diag_send_peripheral_buffering_mode, buffering flag not set for 3
[  474.571003] Fatal error on slpi!
[  474.571089] slpi subsystem failure reason: err_qdi.c:1079:EF:sensor_process:0x1:SNS_SEE_I_1:0x68:sns_stream_service.c:436:req_found.
[  474.571117] subsys-restart: subsystem_restart_dev(): Restart sequence requested for slpi, restart_level = RELATED.
[  474.574318] adsprpc: fastrpc_restart_notifier_cb: slpi subsystem is restarting
[  474.574322] subsys-restart: subsystem_shutdown(): [kworker/u19:0:2054]: Shutting down slpi
[  474.586295] qcom_rpmh DRV:apps_rsc TCS Busy, retrying RPMH message send: addr=0x30030
[  474.586323] qcom_rpmh DRV:apps_rsc TCS Busy, retrying RPMH message send: addr=0x30040
[  474.587793] coresight-remote-etm soc:ssc_etm0: Connection disconnected between QMI handle and 8 service
[  474.587808] sysmon-qmi: ssctl_del_server: Connection lost between QMI handle and slpi's SSCTL service
[  474.592474] adsprpc: fastrpc_rpmsg_remove: closed rpmsg channel of slpi
[  474.592629] adsprpc: fastrpc_restart_notifier_cb: received RAMDUMP notification for slpi
[  474.593885] subsys-restart: subsystem_powerup(): [kworker/u19:0:2054]: Powering up slpi
[  474.594047] subsys-pil-tz 5c00000.qcom,ssc: slpi: loading from 0x0000000088c00000 to 0x000000008a600000
[  474.648774] subsys-pil-tz 5c00000.qcom,ssc: slpi: Brought out of reset
[  474.710135] subsys-pil-tz 5c00000.qcom,ssc: Subsystem error monitoring/handling services are up
[  474.710177] subsys-pil-tz 5c00000.qcom,ssc: slpi: Power/Clock ready interrupt received
[  474.716090] 1118855912:Entered
[  474.716142] adsprpc: fastrpc_restart_notifier_cb: slpi subsystem is up
[  474.716147] subsys-restart: subsystem_restart_wq_func(): [kworker/u19:0:2054]: Restart sequence for slpi completed.
[  474.716593] 1118855912:SMD QRTR driver probed
[  474.718796] adsprpc: fastrpc_rpmsg_probe: opened rpmsg channel for slpi
[  474.724814] sysmon-qmi: ssctl_new_server: Connection established between QMI handle and slpi's SSCTL service
[  474.724833] coresight-remote-etm soc:ssc_etm0: Connection established between QMI handle and 8 service
[  474.730730] diag: In diag_send_peripheral_buffering_mode, buffering flag not set for 3
[  475.966509] Fatal error on slpi!
[  475.966596] slpi subsystem failure reason: err_qdi.c:1079:EF:sensor_process:0x1:SNS_SEE_I_1:0x68:sns_stream_service.c:436:req_found.
[  475.966624] subsys-restart: subsystem_restart_dev(): Restart sequence requested for slpi, restart_level = RELATED.
[  475.969220] adsprpc: fastrpc_restart_notifier_cb: slpi subsystem is restarting
[  475.969224] subsys-restart: subsystem_shutdown(): [kworker/u19:0:2054]: Shutting down slpi
[  475.981165] qcom_rpmh DRV:apps_rsc TCS Busy, retrying RPMH message send: addr=0x30030
[  475.981191] qcom_rpmh DRV:apps_rsc TCS Busy, retrying RPMH message send: addr=0x30040
[  475.983399] coresight-remote-etm soc:ssc_etm0: Connection disconnected between QMI handle and 8 service
[  475.983410] sysmon-qmi: ssctl_del_server: Connection lost between QMI handle and slpi's SSCTL service
[  475.987724] adsprpc: fastrpc_rpmsg_remove: closed rpmsg channel of slpi
[  475.987865] adsprpc: fastrpc_restart_notifier_cb: received RAMDUMP notification for slpi
[  475.989595] subsys-restart: subsystem_powerup(): [kworker/u19:0:2054]: Powering up slpi
[  475.989762] subsys-pil-tz 5c00000.qcom,ssc: slpi: loading from 0x0000000088c00000 to 0x000000008a600000
[  476.047626] subsys-pil-tz 5c00000.qcom,ssc: slpi: Brought out of reset
[  476.107799] subsys-pil-tz 5c00000.qcom,ssc: Subsystem error monitoring/handling services are up
[  476.107835] subsys-pil-tz 5c00000.qcom,ssc: slpi: Power/Clock ready interrupt received
[  476.114130] adsprpc: fastrpc_restart_notifier_cb: slpi subsystem is up
[  476.114135] subsys-restart: subsystem_restart_wq_func(): [kworker/u19:0:2054]: Restart sequence for slpi completed.
[  476.116482] 1118855912:Entered
[  476.119264] 1118855912:SMD QRTR driver probed
[  476.121677] adsprpc: fastrpc_rpmsg_probe: opened rpmsg channel for slpi
[  476.122117] sysmon-qmi: ssctl_new_server: Connection established between QMI handle and slpi's SSCTL service
[  476.122133] coresight-remote-etm soc:ssc_etm0: Connection established between QMI handle and 8 service
[  476.130800] diag: In diag_send_peripheral_buffering_mode, buffering flag not set for 3
[  477.367311] Fatal error on slpi!
[  477.367394] slpi subsystem failure reason: err_qdi.c:1079:EF:sensor_process:0x1:SNS_SEE_I_1:0x68:sns_stream_service.c:436:req_found.
[  477.367420] subsys-restart: subsystem_restart_dev(): Restart sequence requested for slpi, restart_level = RELATED.
[  477.370476] adsprpc: fastrpc_restart_notifier_cb: slpi subsystem is restarting
[  477.370480] subsys-restart: subsystem_shutdown(): [kworker/u19:0:2054]: Shutting down slpi
[  477.382395] qcom_rpmh DRV:apps_rsc TCS Busy, retrying RPMH message send: addr=0x30030
[  477.382419] qcom_rpmh DRV:apps_rsc TCS Busy, retrying RPMH message send: addr=0x30040
[  477.383806] coresight-remote-etm soc:ssc_etm0: Connection disconnected between QMI handle and 8 service
[  477.383817] sysmon-qmi: ssctl_del_server: Connection lost between QMI handle and slpi's SSCTL service
[  477.384136] adsprpc: fastrpc_rpmsg_remove: closed rpmsg channel of slpi
[  477.384263] adsprpc: fastrpc_restart_notifier_cb: received RAMDUMP notification for slpi
[  477.384816] subsys-restart: subsystem_powerup(): [kworker/u19:0:2054]: Powering up slpi
[  477.385120] subsys-pil-tz 5c00000.qcom,ssc: slpi: loading from 0x0000000088c00000 to 0x000000008a600000
[  477.443490] subsys-pil-tz 5c00000.qcom,ssc: slpi: Brought out of reset
[  477.506162] subsys-pil-tz 5c00000.qcom,ssc: Subsystem error monitoring/handling services are up
[  477.506193] subsys-pil-tz 5c00000.qcom,ssc: slpi: Power/Clock ready interrupt received
[  477.506290] qcom_rpmh DRV:apps_rsc TCS Busy, retrying RPMH message send: addr=0x30040
[  477.512803] 1118855912:Entered
[  477.513075] adsprpc: fastrpc_restart_notifier_cb: slpi subsystem is up
[  477.513079] subsys-restart: subsystem_restart_wq_func(): [kworker/u19:0:2054]: Restart sequence for slpi completed.
[  477.513148] 1118855912:SMD QRTR driver probed
[  477.515628] adsprpc: fastrpc_rpmsg_probe: opened rpmsg channel for slpi
[  477.521213] sysmon-qmi: ssctl_new_server: Connection established between QMI handle and slpi's SSCTL service
[  477.521250] coresight-remote-etm soc:ssc_etm0: Connection established between QMI handle and 8 service
[  477.525781] diag: In diag_send_peripheral_buffering_mode, buffering flag not set for 3
[  503.375461] Fatal error on slpi!
[  503.375541] slpi subsystem failure reason: err_qdi.c:1079:EF:sensor_process:0x1:SNS_SEE_I_1:0x68:sns_stream_service.c:436:req_found.
[  503.375566] subsys-restart: subsystem_restart_dev(): Restart sequence requested for slpi, restart_level = RELATED.
[  503.378697] adsprpc: fastrpc_restart_notifier_cb: slpi subsystem is restarting
[  503.378700] subsys-restart: subsystem_shutdown(): [kworker/u19:0:2054]: Shutting down slpi
[  503.390607] qcom_rpmh DRV:apps_rsc TCS Busy, retrying RPMH message send: addr=0x30030
[  503.390638] qcom_rpmh DRV:apps_rsc TCS Busy, retrying RPMH message send: addr=0x30040
[  503.391897] coresight-remote-etm soc:ssc_etm0: Connection disconnected between QMI handle and 8 service
[  503.391976] sysmon-qmi: ssctl_del_server: Connection lost between QMI handle and slpi's SSCTL service
[  503.392269] adsprpc: fastrpc_rpmsg_remove: closed rpmsg channel of slpi
[  503.393461] adsprpc: fastrpc_restart_notifier_cb: received RAMDUMP notification for slpi
[  503.394021] subsys-restart: subsystem_powerup(): [kworker/u19:0:2054]: Powering up slpi
[  503.394144] subsys-pil-tz 5c00000.qcom,ssc: slpi: loading from 0x0000000088c00000 to 0x000000008a600000
[  503.455432] subsys-pil-tz 5c00000.qcom,ssc: slpi: Brought out of reset
[  503.515539] subsys-pil-tz 5c00000.qcom,ssc: Subsystem error monitoring/handling services are up
[  503.515566] subsys-pil-tz 5c00000.qcom,ssc: slpi: Power/Clock ready interrupt received
[  503.521829] 1118855912:Entered
[  503.521855] adsprpc: fastrpc_restart_notifier_cb: slpi subsystem is up
[  503.521861] subsys-restart: subsystem_restart_wq_func(): [kworker/u19:0:2054]: Restart sequence for slpi completed.
[  503.522191] 1118855912:SMD QRTR driver probed
[  503.523845] adsprpc: fastrpc_rpmsg_probe: opened rpmsg channel for slpi
[  503.530404] sysmon-qmi: ssctl_new_server: Connection established between QMI handle and slpi's SSCTL service
[  503.530421] coresight-remote-etm soc:ssc_etm0: Connection established between QMI handle and 8 service
[  503.535973] diag: In diag_send_peripheral_buffering_mode, buffering flag not set for 3
[  928.349273] perf: interrupt took too long (2502 > 2500), lowering kernel.perf_event_max_sample_rate to 79750

[ 1413.270080] perf: interrupt took too long (3128 > 3127), lowering kernel.perf_event_max_sample_rate to 63750
[ 2701.369922] perf: interrupt took too long (3915 > 3910), lowering kernel.perf_event_max_sample_rate to 51000
FCv2 QGC mavlink status when communication working
nsh> mavlink status

instance #0:
    mavlink chan: #0
    type:        GENERIC LINK OR RADIO
    flow control: OFF
    rates:
      tx: 1322.9 B/s
      txerr: 0.0 B/s
      tx rate mult: 0.050
      tx rate max: 1200 B/s
      rx: 4758.9 B/s
      rx loss: 128.0%
    Received Messages:
      sysid:  1, compid:197, Total: 3287 (lost: 425347)
        msgid:    0, Rate:  0.3 Hz, last 0.15s ago
        msgid:  330, Rate:  7.3 Hz, last 0.18s ago
        msgid:  331, Rate: 12.1 Hz, last 0.05s ago
        msgid:   84, Rate: 11.6 Hz, last 0.08s ago
      sysid:  1, compid:196, Total: 37 (lost: 0)
        msgid:    0, Rate:  0.3 Hz, last 2.44s ago
    FTP enabled: YES, TX enabled: YES
    mode: Onboard
    Forwarding: On
    MAVLink version: 2
    transport protocol: serial (/dev/ttyS6 @115200)
FCv2 QGC mavlink status when "connection to mission computer lost"
mavlink status

instance #0:
    mavlink chan: #0
    type:        GENERIC LINK OR RADIO
    flow control: OFF
    rates:
      tx: 1621.3 B/s
      txerr: 0.0 B/s
      tx rate mult: 0.050
      tx rate max: 1200 B/s
      rx: 0.0 B/s
      rx loss: 125.6%
    Received Messages:
      sysid:  1, compid:197, Total: 6025 (lost: 765633)
      sysid:  1, compid:196, Total: 69 (lost: 0)
    FTP enabled: YES, TX enabled: YES
    mode: Onboard
    Forwarding: On
    MAVLink version: 2
    transport protocol: serial (/dev/ttyS6 @115200)
Please update if J18 is usable or not for MAVLink?
@ravi J18 should work. Let's try this one step at a time and see if we can figure out where the issue is. Start by disabling the voxl-mavlink-server, voxl-px4, etc. services and power cycle the VOXL 2. With port set to 12 and baudrate at 57600 does
voxl-mavlink-server -zshow connection with autopilot? If so, does it stay connected? And can you connect GCS? If all of that works fine, power cycle the VOXL 2 and just make sure that it reliably works. Let me know how all that goes before we move to the next step. - MAVLink connections are getting lost in a few minutes.
-
I am testing with J18(VOXl2) and J1(TELEM1) port.
Seems SLPI is throwing a lot of errors in demsg.
and @115200 buadrate.- MAVLink connections are getting lost in a few minutes.
and getting rx loss of 124% on FCv2 QGC.
Can you let me know if the J18 DSP port is buggy or how to fix these errors?
After a few minutes or a few restarts of VOXl-mavlink-server. it stops working and shows an error and exitsCouldn't locate SUID for flight_controller Failed to detect flight controller sensor ERROR: fc_sensor_initialize failed ERROR: Failed to initialize slpi ERROR: Encountered error while initializing bus 12 ERROR: Unable to configure bus 12 (baudrate 115200) with voxl_io Stopping autopilot io module Stopping gcs io module Stopping pipe io module closing remaining client pipes closing remaining server pipes Removing PID file exiting====> dmesg log while voxl-mavlink-server running stopped working and throwing an error when starting
[  460.730018] adsprpc: fastrpc_restart_notifier_cb: received RAMDUMP notification for slpi
[  460.730717] subsys-restart: subsystem_powerup(): [kworker/u19:0:2054]: Powering up slpi
[  460.730901] subsys-pil-tz 5c00000.qcom,ssc: slpi: loading from 0x0000000088c00000 to 0x000000008a600000
[  460.790600] subsys-pil-tz 5c00000.qcom,ssc: slpi: Brought out of reset
[  460.853124] subsys-pil-tz 5c00000.qcom,ssc: Subsystem error monitoring/handling services are up
[  460.853154] subsys-pil-tz 5c00000.qcom,ssc: slpi: Power/Clock ready interrupt received
[  460.860922] adsprpc: fastrpc_restart_notifier_cb: slpi subsystem is up
[  460.860928] subsys-restart: subsystem_restart_wq_func(): [kworker/u19:0:2054]: Restart sequence for slpi completed.
[  460.861499] 1118855912:Entered
[  460.861942] 1118855912:SMD QRTR driver probed
[  460.862983] adsprpc: fastrpc_rpmsg_probe: opened rpmsg channel for slpi
[  460.866169] sysmon-qmi: ssctl_new_server: Connection established between QMI handle and slpi's SSCTL service
[  460.866208] coresight-remote-etm soc:ssc_etm0: Connection established between QMI handle and 8 service
[  460.874694] diag: In diag_send_peripheral_buffering_mode, buffering flag not set for 3
[  462.106273] Fatal error on slpi!
[  462.106348] slpi subsystem failure reason: err_qdi.c:1079:EF:sensor_process:0x1:SNS_SEE_I_1:0x68:sns_stream_service.c:436:req_found.
[  462.106375] subsys-restart: subsystem_restart_dev(): Restart sequence requested for slpi, restart_level = RELATED.
[  462.108414] adsprpc: fastrpc_restart_notifier_cb: slpi subsystem is restarting
[  462.108416] subsys-restart: subsystem_shutdown(): [kworker/u19:0:2054]: Shutting down slpi
[  462.120395] rpmh_rsc_send_data: 17 callbacks suppressed
[  462.120396] qcom_rpmh DRV:apps_rsc TCS Busy, retrying RPMH message send: addr=0x30030
[  462.120423] qcom_rpmh DRV:apps_rsc TCS Busy, retrying RPMH message send: addr=0x30040
[  462.121677] coresight-remote-etm soc:ssc_etm0: Connection disconnected between QMI handle and 8 service
[  462.121691] sysmon-qmi: ssctl_del_server: Connection lost between QMI handle and slpi's SSCTL service
[  462.122027] adsprpc: fastrpc_rpmsg_remove: closed rpmsg channel of slpi
[  462.122151] adsprpc: fastrpc_restart_notifier_cb: received RAMDUMP notification for slpi
[  462.122757] subsys-restart: subsystem_powerup(): [kworker/u19:0:2054]: Powering up slpi
[  462.122886] subsys-pil-tz 5c00000.qcom,ssc: slpi: loading from 0x0000000088c00000 to 0x000000008a600000
[  462.178193] subsys-pil-tz 5c00000.qcom,ssc: slpi: Brought out of reset
[  462.240639] subsys-pil-tz 5c00000.qcom,ssc: Subsystem error monitoring/handling services are up
[  462.240671] subsys-pil-tz 5c00000.qcom,ssc: slpi: Power/Clock ready interrupt received
[  462.240789] qcom_rpmh DRV:apps_rsc TCS Busy, retrying RPMH message send: addr=0x30040
[  462.247665] 1118855912:Entered
[  462.248151] adsprpc: fastrpc_restart_notifier_cb: slpi subsystem is up
[  462.248158] subsys-restart: subsystem_restart_wq_func(): [kworker/u19:0:2054]: Restart sequence for slpi completed.
[  462.249366] 1118855912:SMD QRTR driver probed
[  462.252554] adsprpc: fastrpc_rpmsg_probe: opened rpmsg channel for slpi
[  462.254897] sysmon-qmi: ssctl_new_server: Connection established between QMI handle and slpi's SSCTL service
[  462.254962] coresight-remote-etm soc:ssc_etm0: Connection established between QMI handle and 8 service
[  462.261500] diag: In diag_send_peripheral_buffering_mode, buffering flag not set for 3
[  463.481618] Fatal error on slpi!
[  463.481694] slpi subsystem failure reason: err_qdi.c:1079:EF:sensor_process:0x1:SNS_SEE_I_1:0x68:sns_stream_service.c:436:req_found.
[  463.481720] subsys-restart: subsystem_restart_dev(): Restart sequence requested for slpi, restart_level = RELATED.
[  463.483312] adsprpc: fastrpc_restart_notifier_cb: slpi subsystem is restarting
[  463.483315] subsys-restart: subsystem_shutdown(): [kworker/u19:0:2054]: Shutting down slpi
[  463.495481] qcom_rpmh DRV:apps_rsc TCS Busy, retrying RPMH message send: addr=0x30030
[  463.495494] qcom_rpmh DRV:apps_rsc TCS Busy, retrying RPMH message send: addr=0x30030
[  463.495505] qcom_rpmh DRV:apps_rsc TCS Busy, retrying RPMH message send: addr=0x30030
[  463.495516] qcom_rpmh DRV:apps_rsc TCS Busy, retrying RPMH message send: addr=0x30030
[  463.495528] qcom_rpmh DRV:apps_rsc TCS Busy, retrying RPMH message send: addr=0x30030
[  463.495539] qcom_rpmh DRV:apps_rsc TCS Busy, retrying RPMH message send: addr=0x30030
[  463.495551] qcom_rpmh DRV:apps_rsc TCS Busy, retrying RPMH message send: addr=0x30030
[  463.498539] coresight-remote-etm soc:ssc_etm0: Connection disconnected between QMI handle and 8 service
[  463.498548] sysmon-qmi: ssctl_del_server: Connection lost between QMI handle and slpi's SSCTL service
[  463.498944] adsprpc: fastrpc_rpmsg_remove: closed rpmsg channel of slpi
[  463.499294] adsprpc: fastrpc_restart_notifier_cb: received RAMDUMP notification for slpi
[  463.499834] subsys-restart: subsystem_powerup(): [kworker/u19:0:2054]: Powering up slpi
[  463.499987] subsys-pil-tz 5c00000.qcom,ssc: slpi: loading from 0x0000000088c00000 to 0x000000008a600000
[  463.558705] subsys-pil-tz 5c00000.qcom,ssc: slpi: Brought out of reset
[  463.619354] subsys-pil-tz 5c00000.qcom,ssc: Subsystem error monitoring/handling services are up
[  463.619389] subsys-pil-tz 5c00000.qcom,ssc: slpi: Power/Clock ready interrupt received
[  463.626313] adsprpc: fastrpc_restart_notifier_cb: slpi subsystem is up
[  463.626319] subsys-restart: subsystem_restart_wq_func(): [kworker/u19:0:2054]: Restart sequence for slpi completed.
[  463.629242] 1118855912:Entered
[  463.631383] 1118855912:SMD QRTR driver probed
[  463.633320] sysmon-qmi: ssctl_new_server: Connection established between QMI handle and slpi's SSCTL service
[  463.633334] coresight-remote-etm soc:ssc_etm0: Connection established between QMI handle and 8 service
[  463.633688] adsprpc: fastrpc_rpmsg_probe: opened rpmsg channel for slpi
[  463.641981] diag: In diag_send_peripheral_buffering_mode, buffering flag not set for 3
[  464.864191] Fatal error on slpi!
[  464.864266] slpi subsystem failure reason: err_qdi.c:1079:EF:sensor_process:0x1:SNS_SEE_I_0:0x69:sns_stream_service.c:436:req_found.
[  464.864291] subsys-restart: subsystem_restart_dev(): Restart sequence requested for slpi, restart_level = RELATED.
[  464.867315] adsprpc: fastrpc_restart_notifier_cb: slpi subsystem is restarting
[  464.867320] subsys-restart: subsystem_shutdown(): [kworker/u19:0:2054]: Shutting down slpi
[  464.883697] coresight-remote-etm soc:ssc_etm0: Connection disconnected between QMI handle and 8 service
[  464.883706] sysmon-qmi: ssctl_del_server: Connection lost between QMI handle and slpi's SSCTL service
[  464.885643] adsprpc: fastrpc_rpmsg_remove: closed rpmsg channel of slpi
[  464.885787] adsprpc: fastrpc_restart_notifier_cb: received RAMDUMP notification for slpi
[  464.887190] subsys-restart: subsystem_powerup(): [kworker/u19:0:2054]: Powering up slpi
[  464.887455] subsys-pil-tz 5c00000.qcom,ssc: slpi: loading from 0x0000000088c00000 to 0x000000008a600000
[  464.945581] subsys-pil-tz 5c00000.qcom,ssc: slpi: Brought out of reset
[  465.007996] subsys-pil-tz 5c00000.qcom,ssc: Subsystem error monitoring/handling services are up
[  465.008139] subsys-pil-tz 5c00000.qcom,ssc: slpi: Power/Clock ready interrupt received
[  465.015414] adsprpc: fastrpc_restart_notifier_cb: slpi subsystem is up
[  465.015420] subsys-restart: subsystem_restart_wq_func(): [kworker/u19:0:2054]: Restart sequence for slpi completed.
[  465.015924] 1118855912:Entered
[  465.016498] 1118855912:SMD QRTR driver probed
[  465.019954] adsprpc: fastrpc_rpmsg_probe: opened rpmsg channel for slpi
[  465.023578] sysmon-qmi: ssctl_new_server: Connection established between QMI handle and slpi's SSCTL service
[  465.023627] coresight-remote-etm soc:ssc_etm0: Connection established between QMI handle and 8 service
[  465.029301] diag: In diag_send_peripheral_buffering_mode, buffering flag not set for 3
[  466.256347] Fatal error on slpi!
[  466.256432] slpi subsystem failure reason: err_qdi.c:1079:EF:sensor_process:0x1:SNS_SEE_I_0:0x69:sns_stream_service.c:436:req_found.
[  466.256456] subsys-restart: subsystem_restart_dev(): Restart sequence requested for slpi, restart_level = RELATED.
[  466.259074] adsprpc: fastrpc_restart_notifier_cb: slpi subsystem is restarting
[  466.259079] subsys-restart: subsystem_shutdown(): [kworker/u19:0:2054]: Shutting down slpi
[  466.275522] coresight-remote-etm soc:ssc_etm0: Connection disconnected between QMI handle and 8 service
[  466.275806] sysmon-qmi: ssctl_del_server: Connection lost between QMI handle and slpi's SSCTL service
[  466.277897] adsprpc: fastrpc_rpmsg_remove: closed rpmsg channel of slpi
[  466.278247] adsprpc: fastrpc_restart_notifier_cb: received RAMDUMP notification for slpi
[  466.279336] subsys-restart: subsystem_powerup(): [kworker/u19:0:2054]: Powering up slpi
[  466.279500] subsys-pil-tz 5c00000.qcom,ssc: slpi: loading from 0x0000000088c00000 to 0x000000008a600000
[  466.338642] subsys-pil-tz 5c00000.qcom,ssc: slpi: Brought out of reset
[  466.399095] subsys-pil-tz 5c00000.qcom,ssc: Subsystem error monitoring/handling services are up
[  466.399127] subsys-pil-tz 5c00000.qcom,ssc: slpi: Power/Clock ready interrupt received
[  466.405824] adsprpc: fastrpc_restart_notifier_cb: slpi subsystem is up
[  466.405830] 1118855912:Entered
[  466.405832] subsys-restart: subsystem_restart_wq_func(): [kworker/u19:0:2054]: Restart sequence for slpi completed.
[  466.406031] 1118855912:SMD QRTR driver probed
[  466.407495] adsprpc: fastrpc_rpmsg_probe: opened rpmsg channel for slpi
[  466.411445] coresight-remote-etm soc:ssc_etm0: Connection established between QMI handle and 8 service
[  466.412552] sysmon-qmi: ssctl_new_server: Connection established between QMI handle and slpi's SSCTL service
[  466.419864] diag: In diag_send_peripheral_buffering_mode, buffering flag not set for 3
[  467.641878] Fatal error on slpi!
[  467.641957] slpi subsystem failure reason: err_qdi.c:1079:EF:sensor_process:0x1:SNS_SEE_I_1:0x68:sns_stream_service.c:436:req_found.
[  467.641983] subsys-restart: subsystem_restart_dev(): Restart sequence requested for slpi, restart_level = RELATED.
[  467.644997] adsprpc: fastrpc_restart_notifier_cb: slpi subsystem is restarting
[  467.645001] subsys-restart: subsystem_shutdown(): [kworker/u19:0:2054]: Shutting down slpi
[  467.656914] rpmh_rsc_send_data: 19 callbacks suppressed
[  467.656915] qcom_rpmh DRV:apps_rsc TCS Busy, retrying RPMH message send: addr=0x30030
[  467.656940] qcom_rpmh DRV:apps_rsc TCS Busy, retrying RPMH message send: addr=0x30040
[  467.658270] coresight-remote-etm soc:ssc_etm0: Connection disconnected between QMI handle and 8 service
[  467.658280] sysmon-qmi: ssctl_del_server: Connection lost between QMI handle and slpi's SSCTL service
[  467.658668] adsprpc: fastrpc_rpmsg_remove: closed rpmsg channel of slpi
[  467.659779] adsprpc: fastrpc_restart_notifier_cb: received RAMDUMP notification for slpi
[  467.661747] subsys-restart: subsystem_powerup(): [kworker/u19:0:2054]: Powering up slpi
[  467.661931] subsys-pil-tz 5c00000.qcom,ssc: slpi: loading from 0x0000000088c00000 to 0x000000008a600000
[  467.716145] subsys-pil-tz 5c00000.qcom,ssc: slpi: Brought out of reset
[  467.778657] subsys-pil-tz 5c00000.qcom,ssc: Subsystem error monitoring/handling services are up
[  467.778688] subsys-pil-tz 5c00000.qcom,ssc: slpi: Power/Clock ready interrupt received
[  467.778800] qcom_rpmh DRV:apps_rsc TCS Busy, retrying RPMH message send: addr=0x30040
[  467.786334] adsprpc: fastrpc_restart_notifier_cb: slpi subsystem is up
[  467.786340] subsys-restart: subsystem_restart_wq_func(): [kworker/u19:0:2054]: Restart sequence for slpi completed.
[  467.786864] 1118855912:Entered
[  467.787109] 1118855912:SMD QRTR driver probed
[  467.790948] adsprpc: fastrpc_rpmsg_probe: opened rpmsg channel for slpi
[  467.795012] sysmon-qmi: ssctl_new_server: Connection established between QMI handle and slpi's SSCTL service
[  467.795026] coresight-remote-etm soc:ssc_etm0: Connection established between QMI handle and 8 service
[  467.800505] diag: In diag_send_peripheral_buffering_mode, buffering flag not set for 3
[  469.020359] Fatal error on slpi!
[  469.020432] slpi subsystem failure reason: err_qdi.c:1079:EF:sensor_process:0x1:SNS_SEE_I_0:0x69:sns_stream_service.c:436:req_found.
[  469.020458] subsys-restart: subsystem_restart_dev(): Restart sequence requested for slpi, restart_level = RELATED.
[  469.022405] adsprpc: fastrpc_restart_notifier_cb: slpi subsystem is restarting
[  469.022408] subsys-restart: subsystem_shutdown(): [kworker/u19:0:2054]: Shutting down slpi
[  469.034300] qcom_rpmh DRV:apps_rsc TCS Busy, retrying RPMH message send: addr=0x30030
[  469.034318] qcom_rpmh DRV:apps_rsc TCS Busy, retrying RPMH message send: addr=0x30030
[  469.034337] qcom_rpmh DRV:apps_rsc TCS Busy, retrying RPMH message send: addr=0x30030
[  469.034348] qcom_rpmh DRV:apps_rsc TCS Busy, retrying RPMH message send: addr=0x30030
[  469.034360] qcom_rpmh DRV:apps_rsc TCS Busy, retrying RPMH message send: addr=0x30030
[  469.034371] qcom_rpmh DRV:apps_rsc TCS Busy, retrying RPMH message send: addr=0x30030
[  469.034382] qcom_rpmh DRV:apps_rsc TCS Busy, retrying RPMH message send: addr=0x30030
[  469.040876] coresight-remote-etm soc:ssc_etm0: Connection disconnected between QMI handle and 8 service
[  469.040986] sysmon-qmi: ssctl_del_server: Connection lost between QMI handle and slpi's SSCTL service
[  469.041166] adsprpc: fastrpc_rpmsg_remove: closed rpmsg channel of slpi
[  469.041336] adsprpc: fastrpc_restart_notifier_cb: received RAMDUMP notification for slpi
[  469.042154] subsys-restart: subsystem_powerup(): [kworker/u19:0:2054]: Powering up slpi
[  469.042336] subsys-pil-tz 5c00000.qcom,ssc: slpi: loading from 0x0000000088c00000 to 0x000000008a600000
[  469.101055] subsys-pil-tz 5c00000.qcom,ssc: slpi: Brought out of reset
[  469.161468] subsys-pil-tz 5c00000.qcom,ssc: Subsystem error monitoring/handling services are up
[  469.161515] subsys-pil-tz 5c00000.qcom,ssc: slpi: Power/Clock ready interrupt received
[  469.168694] adsprpc: fastrpc_restart_notifier_cb: slpi subsystem is up
[  469.168702] subsys-restart: subsystem_restart_wq_func(): [kworker/u19:0:2054]: Restart sequence for slpi completed.
[  469.168830] 1118855912:Entered
[  469.169190] 1118855912:SMD QRTR driver probed
[  469.170647] adsprpc: fastrpc_rpmsg_probe: opened rpmsg channel for slpi
[  469.177803] sysmon-qmi: ssctl_new_server: Connection established between QMI handle and slpi's SSCTL service
[  469.178019] coresight-remote-etm soc:ssc_etm0: Connection established between QMI handle and 8 service
[  469.183206] diag: In diag_send_peripheral_buffering_mode, buffering flag not set for 3
[  470.408342] Fatal error on slpi!
[  470.408426] slpi subsystem failure reason: err_qdi.c:1079:EF:sensor_process:0x1:SNS_SEE_I_0:0x69:sns_stream_service.c:436:req_found.
[  470.408454] subsys-restart: subsystem_restart_dev(): Restart sequence requested for slpi, restart_level = RELATED.
[  470.410929] adsprpc: fastrpc_restart_notifier_cb: slpi subsystem is restarting
[  470.410934] subsys-restart: subsystem_shutdown(): [kworker/u19:0:2054]: Shutting down slpi
[  470.428290] sysmon-qmi: ssctl_del_server: Connection lost between QMI handle and slpi's SSCTL service
[  470.428426] coresight-remote-etm soc:ssc_etm0: Connection disconnected between QMI handle and 8 service
[  470.430688] adsprpc: fastrpc_rpmsg_remove: closed rpmsg channel of slpi
[  470.430827] adsprpc: fastrpc_restart_notifier_cb: received RAMDUMP notification for slpi
[  470.431771] subsys-restart: subsystem_powerup(): [kworker/u19:0:2054]: Powering up slpi
[  470.431903] subsys-pil-tz 5c00000.qcom,ssc: slpi: loading from 0x0000000088c00000 to 0x000000008a600000
[  470.491572] subsys-pil-tz 5c00000.qcom,ssc: slpi: Brought out of reset
[  470.554485] subsys-pil-tz 5c00000.qcom,ssc: Subsystem error monitoring/handling services are up
[  470.554528] subsys-pil-tz 5c00000.qcom,ssc: slpi: Power/Clock ready interrupt received
[  470.561372] adsprpc: fastrpc_restart_notifier_cb: slpi subsystem is up
[  470.561377] subsys-restart: subsystem_restart_wq_func(): [kworker/u19:0:2054]: Restart sequence for slpi completed.
[  470.562108] 1118855912:Entered
[  470.562411] 1118855912:SMD QRTR driver probed
[  470.567554] adsprpc: fastrpc_rpmsg_probe: opened rpmsg channel for slpi
[  470.569456] sysmon-qmi: ssctl_new_server: Connection established between QMI handle and slpi's SSCTL service
[  470.569501] coresight-remote-etm soc:ssc_etm0: Connection established between QMI handle and 8 service
[  470.575413] diag: In diag_send_peripheral_buffering_mode, buffering flag not set for 3
[  471.808443] Fatal error on slpi!
[  471.808525] slpi subsystem failure reason: err_qdi.c:1079:EF:sensor_process:0x1:SNS_SEE_I_0:0x69:sns_stream_service.c:436:req_found.
[  471.808553] subsys-restart: subsystem_restart_dev(): Restart sequence requested for slpi, restart_level = RELATED.
[  471.811212] adsprpc: fastrpc_restart_notifier_cb: slpi subsystem is restarting
[  471.811217] subsys-restart: subsystem_shutdown(): [kworker/u19:0:2054]: Shutting down slpi
[  471.827600] coresight-remote-etm soc:ssc_etm0: Connection disconnected between QMI handle and 8 service
[  471.827611] sysmon-qmi: ssctl_del_server: Connection lost between QMI handle and slpi's SSCTL service
[  471.829473] adsprpc: fastrpc_rpmsg_remove: closed rpmsg channel of slpi
[  471.829658] adsprpc: fastrpc_restart_notifier_cb: received RAMDUMP notification for slpi
[  471.830216] subsys-restart: subsystem_powerup(): [kworker/u19:0:2054]: Powering up slpi
[  471.830370] subsys-pil-tz 5c00000.qcom,ssc: slpi: loading from 0x0000000088c00000 to 0x000000008a600000
[  471.885397] subsys-pil-tz 5c00000.qcom,ssc: slpi: Brought out of reset
[  471.947763] subsys-pil-tz 5c00000.qcom,ssc: Subsystem error monitoring/handling services are up
[  471.947797] subsys-pil-tz 5c00000.qcom,ssc: slpi: Power/Clock ready interrupt received
[  471.955860] adsprpc: fastrpc_restart_notifier_cb: slpi subsystem is up
[  471.955865] subsys-restart: subsystem_restart_wq_func(): [kworker/u19:0:2054]: Restart sequence for slpi completed.
[  471.957236] 1118855912:Entered
[  471.958811] 1118855912:SMD QRTR driver probed
[  471.959979] adsprpc: fastrpc_rpmsg_probe: opened rpmsg channel for slpi
[  471.962094] sysmon-qmi: ssctl_new_server: Connection established between QMI handle and slpi's SSCTL service
[  471.962128] coresight-remote-etm soc:ssc_etm0: Connection established between QMI handle and 8 service
[  471.969208] diag: In diag_send_peripheral_buffering_mode, buffering flag not set for 3
[  473.190744] Fatal error on slpi!
[  473.190818] slpi subsystem failure reason: err_qdi.c:1079:EF:sensor_process:0x1:SNS_SEE_I_0:0x69:sns_stream_service.c:436:req_found.
[  473.190843] subsys-restart: subsystem_restart_dev(): Restart sequence requested for slpi, restart_level = RELATED.
[  473.193872] adsprpc: fastrpc_restart_notifier_cb: slpi subsystem is restarting
[  473.193878] subsys-restart: subsystem_shutdown(): [kworker/u19:0:2054]: Shutting down slpi
[  473.205809] rpmh_rsc_send_data: 11 callbacks suppressed
[  473.205810] qcom_rpmh DRV:apps_rsc TCS Busy, retrying RPMH message send: addr=0x30030
[  473.205837] qcom_rpmh DRV:apps_rsc TCS Busy, retrying RPMH message send: addr=0x30040
[  473.206983] coresight-remote-etm soc:ssc_etm0: Connection disconnected between QMI handle and 8 service
[  473.206995] sysmon-qmi: ssctl_del_server: Connection lost between QMI handle and slpi's SSCTL service
[  473.207337] adsprpc: fastrpc_rpmsg_remove: closed rpmsg channel of slpi
[  473.210007] adsprpc: fastrpc_restart_notifier_cb: received RAMDUMP notification for slpi
[  473.210544] subsys-restart: subsystem_powerup(): [kworker/u19:0:2054]: Powering up slpi
[  473.211534] subsys-pil-tz 5c00000.qcom,ssc: slpi: loading from 0x0000000088c00000 to 0x000000008a600000
[  473.267488] subsys-pil-tz 5c00000.qcom,ssc: slpi: Brought out of reset
[  473.329966] subsys-pil-tz 5c00000.qcom,ssc: Subsystem error monitoring/handling services are up
[  473.330083] subsys-pil-tz 5c00000.qcom,ssc: slpi: Power/Clock ready interrupt received
[  473.337309] adsprpc: fastrpc_restart_notifier_cb: slpi subsystem is up
[  473.337313] subsys-restart: subsystem_restart_wq_func(): [kworker/u19:0:2054]: Restart sequence for slpi completed.
[  473.337774] 1118855912:Entered
[  473.338098] 1118855912:SMD QRTR driver probed
[  473.339277] adsprpc: fastrpc_rpmsg_probe: opened rpmsg channel for slpi
[  473.343685] sysmon-qmi: ssctl_new_server: Connection established between QMI handle and slpi's SSCTL service
[  473.343696] coresight-remote-etm soc:ssc_etm0: Connection established between QMI handle and 8 service
[  473.351954] diag: In diag_send_peripheral_buffering_mode, buffering flag not set for 3
[  474.571003] Fatal error on slpi!
[  474.571089] slpi subsystem failure reason: err_qdi.c:1079:EF:sensor_process:0x1:SNS_SEE_I_1:0x68:sns_stream_service.c:436:req_found.
[  474.571117] subsys-restart: subsystem_restart_dev(): Restart sequence requested for slpi, restart_level = RELATED.
[  474.574318] adsprpc: fastrpc_restart_notifier_cb: slpi subsystem is restarting
[  474.574322] subsys-restart: subsystem_shutdown(): [kworker/u19:0:2054]: Shutting down slpi
[  474.586295] qcom_rpmh DRV:apps_rsc TCS Busy, retrying RPMH message send: addr=0x30030
[  474.586323] qcom_rpmh DRV:apps_rsc TCS Busy, retrying RPMH message send: addr=0x30040
[  474.587793] coresight-remote-etm soc:ssc_etm0: Connection disconnected between QMI handle and 8 service
[  474.587808] sysmon-qmi: ssctl_del_server: Connection lost between QMI handle and slpi's SSCTL service
[  474.592474] adsprpc: fastrpc_rpmsg_remove: closed rpmsg channel of slpi
[  474.592629] adsprpc: fastrpc_restart_notifier_cb: received RAMDUMP notification for slpi
[  474.593885] subsys-restart: subsystem_powerup(): [kworker/u19:0:2054]: Powering up slpi
[  474.594047] subsys-pil-tz 5c00000.qcom,ssc: slpi: loading from 0x0000000088c00000 to 0x000000008a600000
[  474.648774] subsys-pil-tz 5c00000.qcom,ssc: slpi: Brought out of reset
[  474.710135] subsys-pil-tz 5c00000.qcom,ssc: Subsystem error monitoring/handling services are up
[  474.710177] subsys-pil-tz 5c00000.qcom,ssc: slpi: Power/Clock ready interrupt received
[  474.716090] 1118855912:Entered
[  474.716142] adsprpc: fastrpc_restart_notifier_cb: slpi subsystem is up
[  474.716147] subsys-restart: subsystem_restart_wq_func(): [kworker/u19:0:2054]: Restart sequence for slpi completed.
[  474.716593] 1118855912:SMD QRTR driver probed
[  474.718796] adsprpc: fastrpc_rpmsg_probe: opened rpmsg channel for slpi
[  474.724814] sysmon-qmi: ssctl_new_server: Connection established between QMI handle and slpi's SSCTL service
[  474.724833] coresight-remote-etm soc:ssc_etm0: Connection established between QMI handle and 8 service
[  474.730730] diag: In diag_send_peripheral_buffering_mode, buffering flag not set for 3
[  475.966509] Fatal error on slpi!
[  475.966596] slpi subsystem failure reason: err_qdi.c:1079:EF:sensor_process:0x1:SNS_SEE_I_1:0x68:sns_stream_service.c:436:req_found.
[  475.966624] subsys-restart: subsystem_restart_dev(): Restart sequence requested for slpi, restart_level = RELATED.
[  475.969220] adsprpc: fastrpc_restart_notifier_cb: slpi subsystem is restarting
[  475.969224] subsys-restart: subsystem_shutdown(): [kworker/u19:0:2054]: Shutting down slpi
[  475.981165] qcom_rpmh DRV:apps_rsc TCS Busy, retrying RPMH message send: addr=0x30030
[  475.981191] qcom_rpmh DRV:apps_rsc TCS Busy, retrying RPMH message send: addr=0x30040
[  475.983399] coresight-remote-etm soc:ssc_etm0: Connection disconnected between QMI handle and 8 service
[  475.983410] sysmon-qmi: ssctl_del_server: Connection lost between QMI handle and slpi's SSCTL service
[  475.987724] adsprpc: fastrpc_rpmsg_remove: closed rpmsg channel of slpi
[  475.987865] adsprpc: fastrpc_restart_notifier_cb: received RAMDUMP notification for slpi
[  475.989595] subsys-restart: subsystem_powerup(): [kworker/u19:0:2054]: Powering up slpi
[  475.989762] subsys-pil-tz 5c00000.qcom,ssc: slpi: loading from 0x0000000088c00000 to 0x000000008a600000
[  476.047626] subsys-pil-tz 5c00000.qcom,ssc: slpi: Brought out of reset
[  476.107799] subsys-pil-tz 5c00000.qcom,ssc: Subsystem error monitoring/handling services are up
[  476.107835] subsys-pil-tz 5c00000.qcom,ssc: slpi: Power/Clock ready interrupt received
[  476.114130] adsprpc: fastrpc_restart_notifier_cb: slpi subsystem is up
[  476.114135] subsys-restart: subsystem_restart_wq_func(): [kworker/u19:0:2054]: Restart sequence for slpi completed.
[  476.116482] 1118855912:Entered
[  476.119264] 1118855912:SMD QRTR driver probed
[  476.121677] adsprpc: fastrpc_rpmsg_probe: opened rpmsg channel for slpi
[  476.122117] sysmon-qmi: ssctl_new_server: Connection established between QMI handle and slpi's SSCTL service
[  476.122133] coresight-remote-etm soc:ssc_etm0: Connection established between QMI handle and 8 service
[  476.130800] diag: In diag_send_peripheral_buffering_mode, buffering flag not set for 3
[  477.367311] Fatal error on slpi!
[  477.367394] slpi subsystem failure reason: err_qdi.c:1079:EF:sensor_process:0x1:SNS_SEE_I_1:0x68:sns_stream_service.c:436:req_found.
[  477.367420] subsys-restart: subsystem_restart_dev(): Restart sequence requested for slpi, restart_level = RELATED.
[  477.370476] adsprpc: fastrpc_restart_notifier_cb: slpi subsystem is restarting
[  477.370480] subsys-restart: subsystem_shutdown(): [kworker/u19:0:2054]: Shutting down slpi
[  477.382395] qcom_rpmh DRV:apps_rsc TCS Busy, retrying RPMH message send: addr=0x30030
[  477.382419] qcom_rpmh DRV:apps_rsc TCS Busy, retrying RPMH message send: addr=0x30040
[  477.383806] coresight-remote-etm soc:ssc_etm0: Connection disconnected between QMI handle and 8 service
[  477.383817] sysmon-qmi: ssctl_del_server: Connection lost between QMI handle and slpi's SSCTL service
[  477.384136] adsprpc: fastrpc_rpmsg_remove: closed rpmsg channel of slpi
[  477.384263] adsprpc: fastrpc_restart_notifier_cb: received RAMDUMP notification for slpi
[  477.384816] subsys-restart: subsystem_powerup(): [kworker/u19:0:2054]: Powering up slpi
[  477.385120] subsys-pil-tz 5c00000.qcom,ssc: slpi: loading from 0x0000000088c00000 to 0x000000008a600000
[  477.443490] subsys-pil-tz 5c00000.qcom,ssc: slpi: Brought out of reset
[  477.506162] subsys-pil-tz 5c00000.qcom,ssc: Subsystem error monitoring/handling services are up
[  477.506193] subsys-pil-tz 5c00000.qcom,ssc: slpi: Power/Clock ready interrupt received
[  477.506290] qcom_rpmh DRV:apps_rsc TCS Busy, retrying RPMH message send: addr=0x30040
[  477.512803] 1118855912:Entered
[  477.513075] adsprpc: fastrpc_restart_notifier_cb: slpi subsystem is up
[  477.513079] subsys-restart: subsystem_restart_wq_func(): [kworker/u19:0:2054]: Restart sequence for slpi completed.
[  477.513148] 1118855912:SMD QRTR driver probed
[  477.515628] adsprpc: fastrpc_rpmsg_probe: opened rpmsg channel for slpi
[  477.521213] sysmon-qmi: ssctl_new_server: Connection established between QMI handle and slpi's SSCTL service
[  477.521250] coresight-remote-etm soc:ssc_etm0: Connection established between QMI handle and 8 service
[  477.525781] diag: In diag_send_peripheral_buffering_mode, buffering flag not set for 3
[  503.375461] Fatal error on slpi!
[  503.375541] slpi subsystem failure reason: err_qdi.c:1079:EF:sensor_process:0x1:SNS_SEE_I_1:0x68:sns_stream_service.c:436:req_found.
[  503.375566] subsys-restart: subsystem_restart_dev(): Restart sequence requested for slpi, restart_level = RELATED.
[  503.378697] adsprpc: fastrpc_restart_notifier_cb: slpi subsystem is restarting
[  503.378700] subsys-restart: subsystem_shutdown(): [kworker/u19:0:2054]: Shutting down slpi
[  503.390607] qcom_rpmh DRV:apps_rsc TCS Busy, retrying RPMH message send: addr=0x30030
[  503.390638] qcom_rpmh DRV:apps_rsc TCS Busy, retrying RPMH message send: addr=0x30040
[  503.391897] coresight-remote-etm soc:ssc_etm0: Connection disconnected between QMI handle and 8 service
[  503.391976] sysmon-qmi: ssctl_del_server: Connection lost between QMI handle and slpi's SSCTL service
[  503.392269] adsprpc: fastrpc_rpmsg_remove: closed rpmsg channel of slpi
[  503.393461] adsprpc: fastrpc_restart_notifier_cb: received RAMDUMP notification for slpi
[  503.394021] subsys-restart: subsystem_powerup(): [kworker/u19:0:2054]: Powering up slpi
[  503.394144] subsys-pil-tz 5c00000.qcom,ssc: slpi: loading from 0x0000000088c00000 to 0x000000008a600000
[  503.455432] subsys-pil-tz 5c00000.qcom,ssc: slpi: Brought out of reset
[  503.515539] subsys-pil-tz 5c00000.qcom,ssc: Subsystem error monitoring/handling services are up
[  503.515566] subsys-pil-tz 5c00000.qcom,ssc: slpi: Power/Clock ready interrupt received
[  503.521829] 1118855912:Entered
[  503.521855] adsprpc: fastrpc_restart_notifier_cb: slpi subsystem is up
[  503.521861] subsys-restart: subsystem_restart_wq_func(): [kworker/u19:0:2054]: Restart sequence for slpi completed.
[  503.522191] 1118855912:SMD QRTR driver probed
[  503.523845] adsprpc: fastrpc_rpmsg_probe: opened rpmsg channel for slpi
[  503.530404] sysmon-qmi: ssctl_new_server: Connection established between QMI handle and slpi's SSCTL service
[  503.530421] coresight-remote-etm soc:ssc_etm0: Connection established between QMI handle and 8 service
[  503.535973] diag: In diag_send_peripheral_buffering_mode, buffering flag not set for 3
[  928.349273] perf: interrupt took too long (2502 > 2500), lowering kernel.perf_event_max_sample_rate to 79750

[ 1413.270080] perf: interrupt took too long (3128 > 3127), lowering kernel.perf_event_max_sample_rate to 63750
[ 2701.369922] perf: interrupt took too long (3915 > 3910), lowering kernel.perf_event_max_sample_rate to 51000
FCv2 QGC mavlink status when communication working
nsh> mavlink status

instance #0:
    mavlink chan: #0
    type:        GENERIC LINK OR RADIO
    flow control: OFF
    rates:
      tx: 1322.9 B/s
      txerr: 0.0 B/s
      tx rate mult: 0.050
      tx rate max: 1200 B/s
      rx: 4758.9 B/s
      rx loss: 128.0%
    Received Messages:
      sysid:  1, compid:197, Total: 3287 (lost: 425347)
        msgid:    0, Rate:  0.3 Hz, last 0.15s ago
        msgid:  330, Rate:  7.3 Hz, last 0.18s ago
        msgid:  331, Rate: 12.1 Hz, last 0.05s ago
        msgid:   84, Rate: 11.6 Hz, last 0.08s ago
      sysid:  1, compid:196, Total: 37 (lost: 0)
        msgid:    0, Rate:  0.3 Hz, last 2.44s ago
    FTP enabled: YES, TX enabled: YES
    mode: Onboard
    Forwarding: On
    MAVLink version: 2
    transport protocol: serial (/dev/ttyS6 @115200)
FCv2 QGC mavlink status when "connection to mission computer lost"
mavlink status

instance #0:
    mavlink chan: #0
    type:        GENERIC LINK OR RADIO
    flow control: OFF
    rates:
      tx: 1621.3 B/s
      txerr: 0.0 B/s
      tx rate mult: 0.050
      tx rate max: 1200 B/s
      rx: 0.0 B/s
      rx loss: 125.6%
    Received Messages:
      sysid:  1, compid:197, Total: 6025 (lost: 765633)
      sysid:  1, compid:196, Total: 69 (lost: 0)
    FTP enabled: YES, TX enabled: YES
    mode: Onboard
    Forwarding: On
    MAVLink version: 2
    transport protocol: serial (/dev/ttyS6 @115200)
Please update if J18 is usable or not for MAVLink?
@ravi Keep in mind you must power cycle the VOXL 2 between each thing you do because the DSP (SLPI) won't cleanly shut down and if you try to start voal-mavlink-server again it will fail.
- MAVLink connections are getting lost in a few minutes.
-
I tested J18(VOXl2) SDK 1.5 and J1(FCv2) firmware V1.15.2.
VOXL2 is connected with FCv2.
FCv2 connected with QGC.I rebooted VOXL2. But after a few minutes, MAVLink connection broke.
I will test J18 later.
Now, to move forward. using J9 for 5G modem and connected with J1 FCv2.
Connection seems stable. Now the connection is lost.But now the major issue is that RX loss is 124%.
I disabled messages 331,84 and configured 330 @ 10Hz.Still, I am experiencing a 21.3% Rx loss.
The only messages visible is Heatbeat(0) and Obstacle_distance(330).I did check. How many messages does FCv2 lose?
seems to be successfully receiving only 10-11 messages per second
and losing 254 messages per second.
So, actually getting only <5% messages successfully.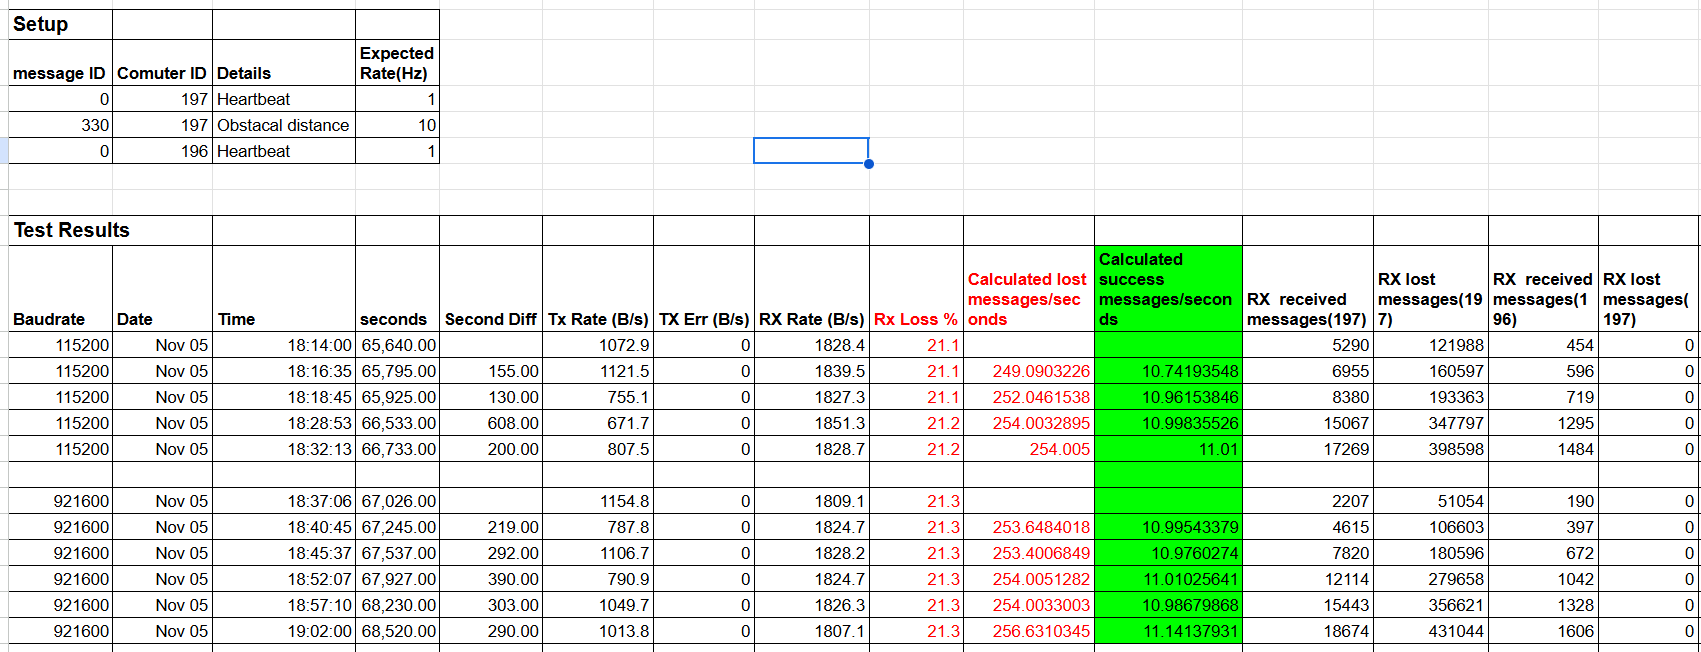
mavlink status with VOXL2 default configuration of vision-hub
instance #0:
    mavlink chan: #0
    type:        GENERIC LINK OR RADIO
    flow control: ON
    rates:
      tx: 639.8 B/s
      txerr: 0.0 B/s
      tx rate mult: 0.302
      tx rate max: 1200 B/s
      rx: 13464.5 B/s
      rx loss: 124.4%
    Received Messages:
      sysid:  1, compid:197, Total: 97158 (lost: 12227092)
        msgid:    0, Rate:  1.0 Hz, last 0.04s ago
        msgid:   84, Rate: 31.3 Hz, last 0.01s ago
        msgid:  331, Rate: 32.4 Hz, last 0.03s ago
        msgid:  330, Rate: 20.3 Hz, last 0.02s ago
      sysid:  1, compid:196, Total: 1135 (lost: 0)
        msgid:    0, Rate:  0.9 Hz, last 0.08s ago
    FTP enabled: YES, TX enabled: YES
    mode: Normal
    Forwarding: On
    MAVLink version: 2
    transport protocol: serial (/dev/ttyS6 @230400)
mavlink status with VOXL2 disabled 331, 84, and 331@10Hz in vision-hub config
instance #0:
    mavlink chan: #0
    type:        GENERIC LINK OR RADIO
    flow control: OFF
    rates:
      tx: 1106.7 B/s
      txerr: 0.0 B/s
      tx rate mult: 0.310
      tx rate max: 1200 B/s
      rx: 1828.2 B/s
      rx loss: 21.3%
    Received Messages:
      sysid:  1, compid:197, Total: 7820 (lost: 180596)
        msgid:    0, Rate:  1.0 Hz, last 0.37s ago
        msgid:  330, Rate: 10.0 Hz, last 0.06s ago
      sysid:  1, compid:196, Total: 672 (lost: 0)
        msgid:    0, Rate:  0.9 Hz, last 0.97s ago
    FTP enabled: YES, TX enabled: YES
    mode: Normal
    Forwarding: On
    MAVLink version: 2
    transport protocol: serial (/dev/ttyS6 @921600)
mavlink status with VOXL2 disabled 331, 84, and 331@10Hz in vision-hub config
- if MAVLink mode changed to onboard mode
instance #0: mavlink chan: #0 type: GENERIC LINK OR RADIO flow control: OFF rates: tx: 21751.5 B/s txerr: 0.0 B/s tx rate mult: 1.000 tx rate max: 46080 B/s rx: 2429.8 B/s rx loss: 82.9% Received Messages: sysid: 1, compid:197, Total: 44616 (lost: 3811731) msgid: 0, Rate: 1.0 Hz, last 0.51s ago msgid: 330, Rate: 10.0 Hz, last 0.01s ago msgid: 111, Rate:100.9 Hz, last 0.08s ago sysid: 1, compid:196, Total: 1358 (lost: 0) msgid: 0, Rate: 0.9 Hz, last 1.02s ago FTP enabled: YES, TX enabled: YES mode: Onboard Forwarding: On MAVLink version: 2 transport protocol: serial (/dev/ttyS6 @921600)- Is it expected behaviour?
- How to debug Rx loss?
Also, there is a huge difference in success and loss. - Is PX4 filtering or discarding packets?
- Originally, we were losing 95% messages, and it is showing 21.3% loss.
- How to calculate Rx loss because the actual is way higher?
-
I tested J18(VOXl2) SDK 1.5 and J1(FCv2) firmware V1.15.2.
VOXL2 is connected with FCv2.
FCv2 connected with QGC.I rebooted VOXL2. But after a few minutes, MAVLink connection broke.
I will test J18 later.
Now, to move forward. using J9 for 5G modem and connected with J1 FCv2.
Connection seems stable. Now the connection is lost.But now the major issue is that RX loss is 124%.
I disabled messages 331,84 and configured 330 @ 10Hz.Still, I am experiencing a 21.3% Rx loss.
The only messages visible is Heatbeat(0) and Obstacle_distance(330).I did check. How many messages does FCv2 lose?
seems to be successfully receiving only 10-11 messages per second
and losing 254 messages per second.
So, actually getting only <5% messages successfully.mavlink status with VOXL2 default configuration of vision-hub
instance #0:
    mavlink chan: #0
    type:        GENERIC LINK OR RADIO
    flow control: ON
    rates:
      tx: 639.8 B/s
      txerr: 0.0 B/s
      tx rate mult: 0.302
      tx rate max: 1200 B/s
      rx: 13464.5 B/s
      rx loss: 124.4%
    Received Messages:
      sysid:  1, compid:197, Total: 97158 (lost: 12227092)
        msgid:    0, Rate:  1.0 Hz, last 0.04s ago
        msgid:   84, Rate: 31.3 Hz, last 0.01s ago
        msgid:  331, Rate: 32.4 Hz, last 0.03s ago
        msgid:  330, Rate: 20.3 Hz, last 0.02s ago
      sysid:  1, compid:196, Total: 1135 (lost: 0)
        msgid:    0, Rate:  0.9 Hz, last 0.08s ago
    FTP enabled: YES, TX enabled: YES
    mode: Normal
    Forwarding: On
    MAVLink version: 2
    transport protocol: serial (/dev/ttyS6 @230400)
mavlink status with VOXL2 disabled 331, 84, and 331@10Hz in vision-hub config
instance #0:
    mavlink chan: #0
    type:        GENERIC LINK OR RADIO
    flow control: OFF
    rates:
      tx: 1106.7 B/s
      txerr: 0.0 B/s
      tx rate mult: 0.310
      tx rate max: 1200 B/s
      rx: 1828.2 B/s
      rx loss: 21.3%
    Received Messages:
      sysid:  1, compid:197, Total: 7820 (lost: 180596)
        msgid:    0, Rate:  1.0 Hz, last 0.37s ago
        msgid:  330, Rate: 10.0 Hz, last 0.06s ago
      sysid:  1, compid:196, Total: 672 (lost: 0)
        msgid:    0, Rate:  0.9 Hz, last 0.97s ago
    FTP enabled: YES, TX enabled: YES
    mode: Normal
    Forwarding: On
    MAVLink version: 2
    transport protocol: serial (/dev/ttyS6 @921600)
mavlink status with VOXL2 disabled 331, 84, and 331@10Hz in vision-hub config
- if MAVLink mode changed to onboard mode
instance #0: mavlink chan: #0 type: GENERIC LINK OR RADIO flow control: OFF rates: tx: 21751.5 B/s txerr: 0.0 B/s tx rate mult: 1.000 tx rate max: 46080 B/s rx: 2429.8 B/s rx loss: 82.9% Received Messages: sysid: 1, compid:197, Total: 44616 (lost: 3811731) msgid: 0, Rate: 1.0 Hz, last 0.51s ago msgid: 330, Rate: 10.0 Hz, last 0.01s ago msgid: 111, Rate:100.9 Hz, last 0.08s ago sysid: 1, compid:196, Total: 1358 (lost: 0) msgid: 0, Rate: 0.9 Hz, last 1.02s ago FTP enabled: YES, TX enabled: YES mode: Onboard Forwarding: On MAVLink version: 2 transport protocol: serial (/dev/ttyS6 @921600)- Is it expected behaviour?
- How to debug Rx loss?
Also, there is a huge difference in success and loss. - Is PX4 filtering or discarding packets?
- Originally, we were losing 95% messages, and it is showing 21.3% loss.
- How to calculate Rx loss because the actual is way higher?
@ravi It's acting like you have a mismatch in baudrate settings for the UARTs. Try setting the baudrate to 115200 for port 12 in /etc/modalai/voxl-mavlink-server.conf. In order to setup the FCv2 connect to QGC with USB and set SER_TEL1_BAUD to 115200 8N1, then reboot. Make sure you are connected to the TELEM1 connector on FCv2 and J18 on VOXL 2.
-
@ravi It's acting like you have a mismatch in baudrate settings for the UARTs. Try setting the baudrate to 115200 for port 12 in /etc/modalai/voxl-mavlink-server.conf. In order to setup the FCv2 connect to QGC with USB and set SER_TEL1_BAUD to 115200 8N1, then reboot. Make sure you are connected to the TELEM1 connector on FCv2 and J18 on VOXL 2.
As said,
I will test J18 later.Currently, I am using J9 of a 5G modem and connected with J1 of FCv2.
Connection seems stable. using a 921600 baud rate with port 2.
The major issue is RX loss.seeing 95% message loss, as I explained in an earlier post.
below is mavlink status visible on QGC mavlink console:
nsh> mavlink status

instance #0:
    mavlink chan: #0
    type:        GENERIC LINK OR RADIO
    flow control: OFF
    rates:
      tx: 1106.7 B/s
      txerr: 0.0 B/s
      tx rate mult: 0.310
      tx rate max: 1200 B/s
      rx: 1828.2 B/s
      rx loss: 21.3%
    Received Messages:
      sysid:  1, compid:197, Total: 7820 (lost: 180596)
        msgid:    0, Rate:  1.0 Hz, last 0.37s ago
        msgid:  330, Rate: 10.0 Hz, last 0.06s ago
      sysid:  1, compid:196, Total: 672 (lost: 0)
        msgid:    0, Rate:  0.9 Hz, last 0.97s ago
    FTP enabled: YES, TX enabled: YES
    mode: Normal
    Forwarding: On
    MAVLink version: 2
    transport protocol: serial (/dev/ttyS6 @921600)
As above, the RX loss showing is 21.3% which is huge.
It is in normal mode. If I change the mavling mode to onboard, it is an 83% loss. and with vision hub odomatry, distance massages it is getting worst like 125%.Now. This Rx loss does not match the number.
sysid: 1, compid:197, Total: 7820 (lost: 180596)As per this MAVLink status, the total successfully received messages are 7820, and the lost are 180596.
So, actual loss is (180596/(7820+180596)) = 95.8%.
And it is showing only 21.3%.So, MAVLink is working between VOXl2 and FCv2. Currently using UART port 2 of VOXl2, not 12. I will debug it later. Once setup is complete.
-
As said,
I will test J18 later.Currently, I am using J9 of a 5G modem and connected with J1 of FCv2.
Connection seems stable. using a 921600 baud rate with port 2.
The major issue is RX loss.seeing 95% message loss, as I explained in an earlier post.
below is mavlink status visible on QGC mavlink console:
nsh> mavlink status

instance #0:
    mavlink chan: #0
    type:        GENERIC LINK OR RADIO
    flow control: OFF
    rates:
      tx: 1106.7 B/s
      txerr: 0.0 B/s
      tx rate mult: 0.310
      tx rate max: 1200 B/s
      rx: 1828.2 B/s
      rx loss: 21.3%
    Received Messages:
      sysid:  1, compid:197, Total: 7820 (lost: 180596)
        msgid:    0, Rate:  1.0 Hz, last 0.37s ago
        msgid:  330, Rate: 10.0 Hz, last 0.06s ago
      sysid:  1, compid:196, Total: 672 (lost: 0)
        msgid:    0, Rate:  0.9 Hz, last 0.97s ago
    FTP enabled: YES, TX enabled: YES
    mode: Normal
    Forwarding: On
    MAVLink version: 2
    transport protocol: serial (/dev/ttyS6 @921600)
As above, the RX loss showing is 21.3% which is huge.
It is in normal mode. If I change the mavling mode to onboard, it is an 83% loss. and with vision hub odomatry, distance massages it is getting worst like 125%.Now. This Rx loss does not match the number.
sysid: 1, compid:197, Total: 7820 (lost: 180596)As per this MAVLink status, the total successfully received messages are 7820, and the lost are 180596.
So, actual loss is (180596/(7820+180596)) = 95.8%.
And it is showing only 21.3%.So, MAVLink is working between VOXl2 and FCv2. Currently using UART port 2 of VOXl2, not 12. I will debug it later. Once setup is complete.
@ravi Here is what I see on my setup testing with baudrate 921600, TELEM1 (J1), and J18 (12):
nsh> mavlink status instance #0: GCS heartbeat valid mavlink chan: #0 type: GENERIC LINK OR RADIO flow control: OFF rates: tx: 1773.5 B/s txerr: 0.0 B/s tx rate mult: 1.000 tx rate max: 46080 B/s rx: 570.5 B/s rx loss: 0.0% Received Messages: sysid:255, compid:190, Total: 2341 (lost: 57) msgid: 126, Rate: nan Hz, last 0.01s ago msgid: 4, Rate: 0.1 Hz, last 2.27s ago msgid: 0, Rate: 1.0 Hz, last 0.58s ago msgid: 69, Rate: 29.1 Hz, last 0.02s ago sysid: 1, compid:197, Total: 108 (lost: 0) msgid: 0, Rate: 1.0 Hz, last 0.86s ago FTP enabled: YES, TX enabled: YES mode: Normal Forwarding: Off MAVLink version: 2 transport protocol: serial (/dev/ttyS6 @921600) ping statistics: last: 14.29 ms mean: 31.46 ms max: 135.44 ms min: 13.21 ms dropped packets: 0 -
As said,
I will test J18 later.Currently, I am using J9 of a 5G modem and connected with J1 of FCv2.
Connection seems stable. using a 921600 baud rate with port 2.
The major issue is RX loss.seeing 95% message loss, as I explained in an earlier post.
below is mavlink status visible on QGC mavlink console:
nsh> mavlink status

instance #0:
    mavlink chan: #0
    type:        GENERIC LINK OR RADIO
    flow control: OFF
    rates:
      tx: 1106.7 B/s
      txerr: 0.0 B/s
      tx rate mult: 0.310
      tx rate max: 1200 B/s
      rx: 1828.2 B/s
      rx loss: 21.3%
    Received Messages:
      sysid:  1, compid:197, Total: 7820 (lost: 180596)
        msgid:    0, Rate:  1.0 Hz, last 0.37s ago
        msgid:  330, Rate: 10.0 Hz, last 0.06s ago
      sysid:  1, compid:196, Total: 672 (lost: 0)
        msgid:    0, Rate:  0.9 Hz, last 0.97s ago
    FTP enabled: YES, TX enabled: YES
    mode: Normal
    Forwarding: On
    MAVLink version: 2
    transport protocol: serial (/dev/ttyS6 @921600)
As above, the RX loss showing is 21.3% which is huge.
It is in normal mode. If I change the mavling mode to onboard, it is an 83% loss. and with vision hub odomatry, distance massages it is getting worst like 125%.Now. This Rx loss does not match the number.
sysid: 1, compid:197, Total: 7820 (lost: 180596)As per this MAVLink status, the total successfully received messages are 7820, and the lost are 180596.
So, actual loss is (180596/(7820+180596)) = 95.8%.
And it is showing only 21.3%.So, MAVLink is working between VOXl2 and FCv2. Currently using UART port 2 of VOXl2, not 12. I will debug it later. Once setup is complete.
@ravi I'm suspecting you have a bad cable or the cable is subject to some interference. Can you try this on a benchtop with just a VOXL 2 and an FC v2 and no other components? Is it currently integrated into a custom drone? Can you look at the signal quality on the TX and RX UART lines with an oscilloscope?

Reading along? Create a free ModalAI Forum account to join in.
With an account you can reply, ask your own question, get an email when a ModalAI engineer answers, and mark the reply that solved it. Your place in each thread is saved between visits.
Questions about VOXL, Flight Core, ESCs and ModalAI drones are answered here by the engineers who build them.
Register Login